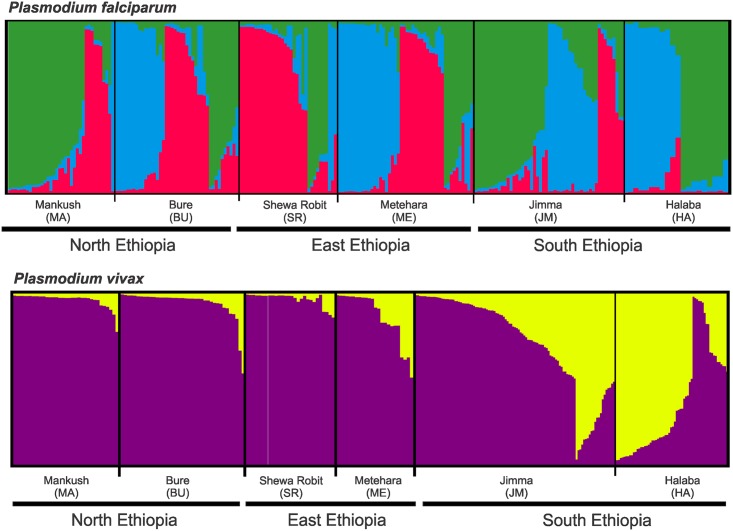
Fig 2. Bayesian inferences of the K clusters estimated by STRUCTURE among Plasmodium falciparum and P. vivax samples.
The most probable clusters are labeled by different colors, and individuals are represented as columns. Within each column (individual), the extent of the component colors indicates the magnitude of the membership coefficient (Q) corresponding to each cluster. Q values of respective clusters are presented in S5 Table.

