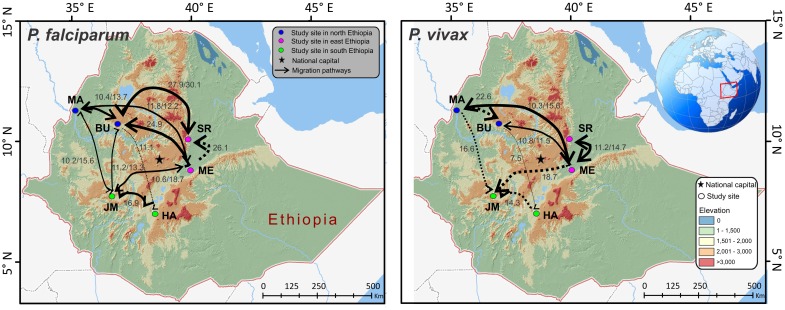
Fig 4. Migratory pathways and rates of Plasmodium falciparum and P. vivax among the study sites in Ethiopia.
The intensity of gene flow is indicated by the thickness of migration paths. Solid lines denote bi-directional migration and dotted lines denote uni-directional migration. Only migration rate (M: immigration rate scaled by mutation rate) with a value of ≥10 are indicated on the maps. All values are presented in S6 Table.

