Figure 3.
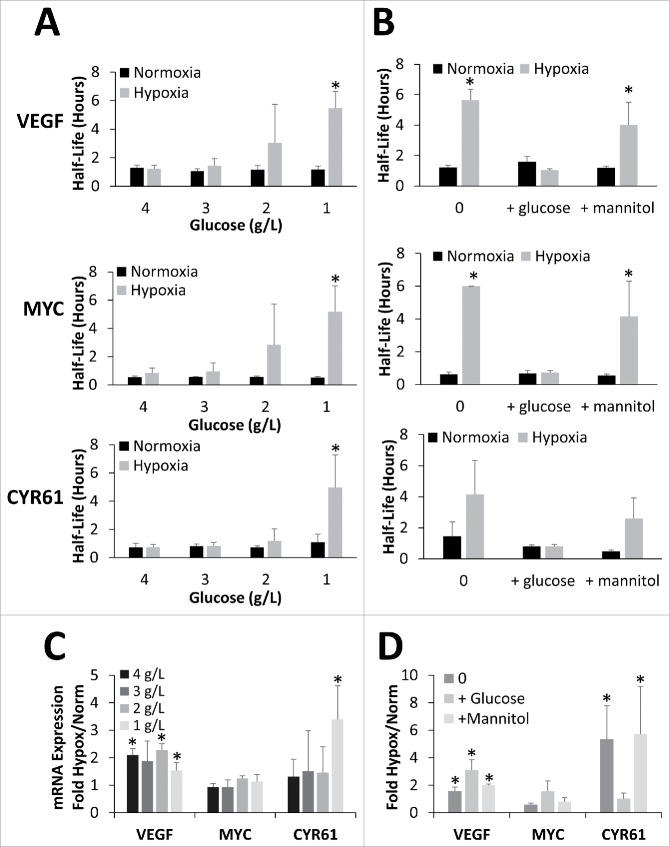
mRNA stabilization is dependent on glucose concentration but not osmolarity. (A) HEK293T cells exposed to 24 hours of Normoxia or Hypoxia (1% O2) in the presence of 4, 3, 2, or 1 g/L glucose before being treated with Actinomycin D for 0, 1 or 2 hours. (B) HEK293T cells exposed to 24 hours of Normoxia or Hypoxia (1% O2) in the presence of glucose free DMEM alone (0) or supplemented with 4.5 g/L glucose or mannitol before being treated with Actinomycin D for 0, 1 or 2 hours. (A, B) mRNA levels of VEFG165, MYC, and CYR61 were determined via qPCR, normalized to GAPDH and 0 hour time point and half-lives determined. (C, D) Relative mRNA expression (fold change) in response to hypoxic conditions (Hypox) expressed as fold change from normoxic values (Norm). Data represents average of N = 5 (A, C) or 4 (B, D) ± SD for each condition. *P ≤ 0.05 from respective Normoxic condition.

