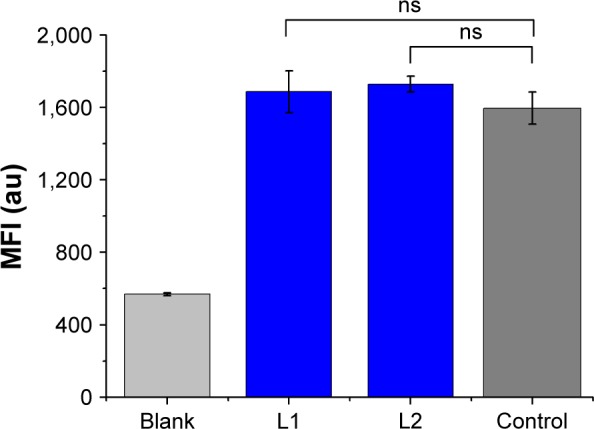
Figure 6.

Effects of L1 and L2 on Rh 123 accumulation in the chemoresistant MCF-7/ADR cells after 48 h incubation of L1 and L2.
Notes: Each bar represents the mean fluorescent intensity (MFI) ±SD. ns indicates no significant difference between the treated groups and untreated group (control).
