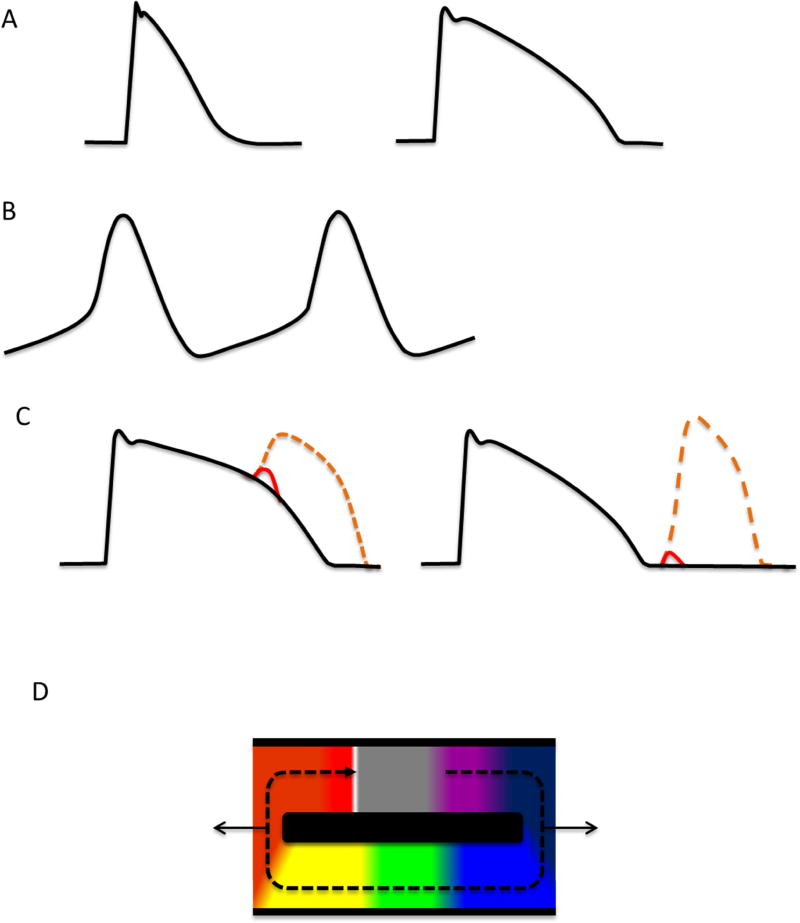
Figure 1.
Arrhythmia mechanisms (A) the normal morphologies of atrial (left) and ventricular (right) action potentials are shown. Normally, cardiac myocytes outside the specialized conduction system are quiescent and the cell maintains a polarized state with a stable negative resting membrane potential (baseline). (B) Unlike the stable baseline of normal myocytes, cells with automaticity (either cells from the specialized conduction system, cells modified to develop automaticity, or injured myocytes) have an unstable baseline with gradual depolarization. The slow rate of depolarization generally inactivated the sodium current that is responsible for the rapid depolarization noted for atrial and ventricular myocytes in panel A. A calcium current is generally responsible for activation in automatic cells. The slower kinetics of the calcium current account for the less sharp depolarization in comparison to normal atrial and ventricular myocytes. (C) Triggered arrhythmias are generated from secondary electrical activation of the cardiac myocyte, either in the later stages of the initial action potential (early afterdepolarization, depicted on the left) or after completion of the prior action potential (delayed afterdepolarization, right panel). Activations can either be small shifts in membrane potential (red line) or full secondary action potentials (orange dotted line). Afterdepolarizations are generally triggered by abnormal behavior of the cellular ionic currents and/or intracellular calcium handling processes. (D) Unlike the automaticity and triggered activity that are largely cellular processes, reentry is a tissue level process. Fixed or functional barriers (black bars) allow progressive activation of the loop of tissue inside the barrier. In the schematic, the active electrical wavefront is the white bar. The progression of red-orange-yellow-green-blue-violet represents the tissue in various stages of electrical recovery from the prior action potential, and the gray region is myocardial tissue that has recovered from the prior action potential and is capable of generating a new action potential when activated. The dotted arrow shows progression of the activation wavefront around the reentrant circuit, and the solid arrows show escape of the electrical activation to surrounding tissues. A heart beat is generated for each revolution of the circuit. Reentry can be disrupted when the activation wavefront meets refractory tissue (i.e. no gray region. This occurs either with increased speed of conduction around the circuit or with a delay in electrical recovery of cells within the circuit.

