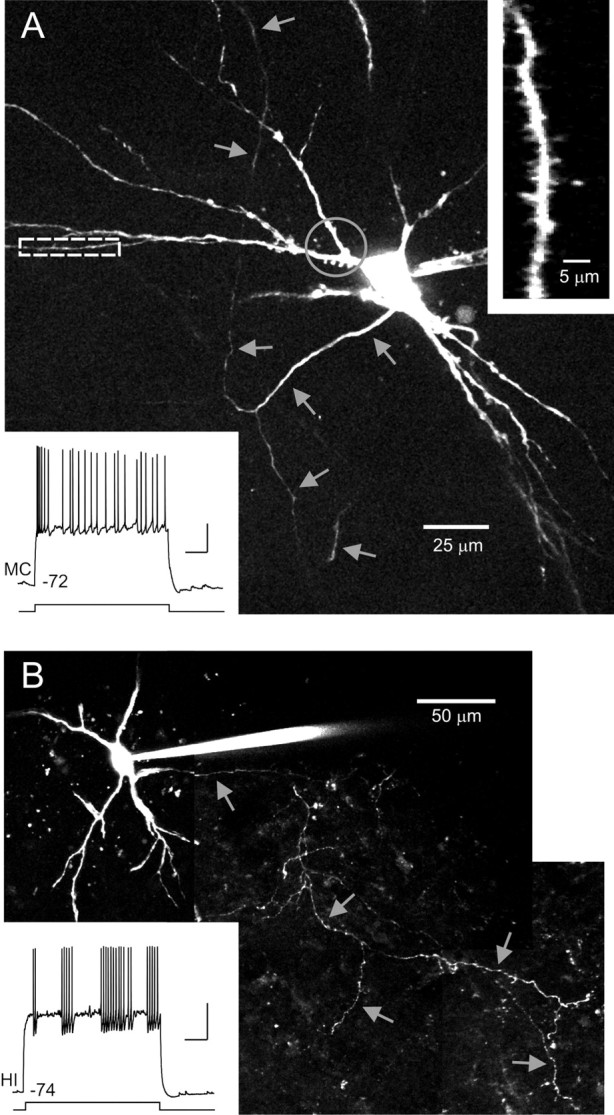
Figure 6.

Morphology of hilar neurons. A, Morphology of intracellularly filled mossy cell. Montage of maximal projections from Z-stacks acquired through two-photon imaging of a live brain slice. Gray arrows indicate axonal processes. Enlargement of distal dendrite segment shown in right inset. Enlarged area indicated by white dashed rectangle in main image. Gray circle indicates proximal dendritic segments with thorny excrescences. Bottom inset shows example response of neuron to 3 s depolarizing step (350 pA). Distance metric, 1.04. B, Morphology of filled hilar interneuron. Gray arrows indicate axonal processes. Bottom inset shows example response of interneuron to a 200 pA depolarizing step. Distance metric, −1.31. Calibration: 20 mV, 500 ms (both insets).
