
Fig. 1.
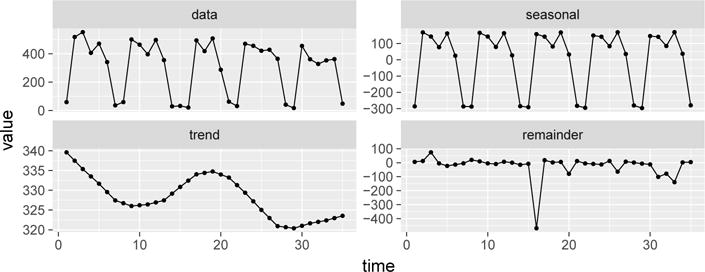
Seasonal-Trend (STL) decomposition of a time series. The top-right graph shows the original data, which has a strong (weekly) seasonality. The following graphs show the seasonal, trend, and remainder signals decomposed from the original time series. Notice the point at time 16 is an outlier.