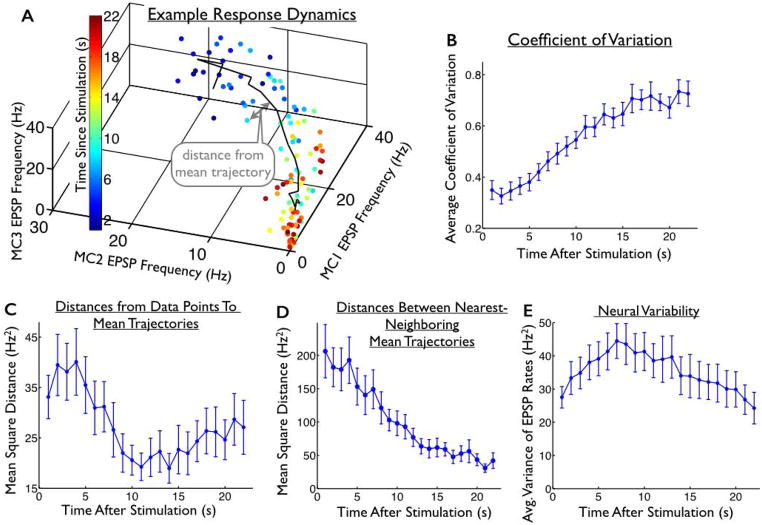
Fig. 3. Structure of the trial-to-trial variability in the evoked responses.
(A) Responses of one mossy cell triplet to one location of stimulation. Each dot represents the mean EPSP frequencies in a 1s window on a given trial; 5 trials are shown. The colors of the dots indicate the time since stimulation. Black line represents the mean trajectory, averaged over trials. (B) Average coefficient of variation (standard deviation divided by mean) of the neural responses, as a function of when they were observed. (C) For each data point, we measured the distance to the nearest point on the mean trajectory. The mean of these distances (averaged over trials) is shown as a function of time since stimulation. During the first ~12s of the responses, these distances decrease. (D) For comparison, we also show the mean squared distances between the mean trajectories and their nearest-neighboring trajectory. (E) Average (over cells and stimuli) of the trial-to-trial variance in neural responses, as a function of time since stimulation. The (average) level of variability increases over the first ~10s of the responses, then decreases. Thus, during the first ~10s of the responses, the overall response variability increases (BE) while the distances from the data points to the mean trajectories decrease (C), underlining the fact that response variability is not evenly spread over the space of possible neural activities. Error bars in all panels represent the standard error of the mean (S.E.M.) over all 4 stimuli and 9 slice experiments.

