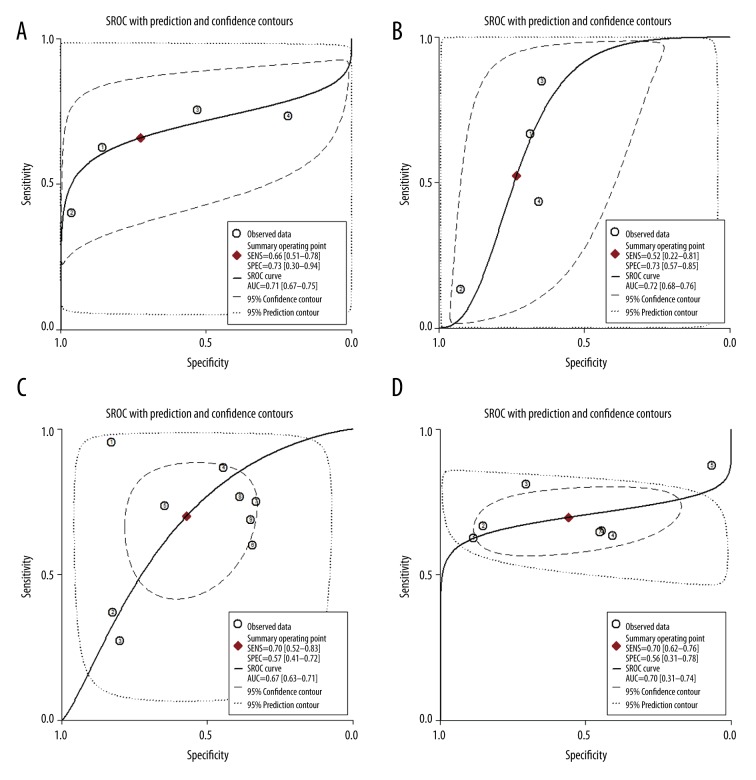
Figure 3.
Summary ROC curves for the performance of LLC and its individual component-based CMRI for the diagnosis of MC. (A) Summary ROC curve for gRE; (B) Summary ROC curve for ER; (C) Summary ROC curve for LGE; (D) Summary ROC curve for LLC; Summary ROC curves were based on the bivariate random-effects model.

