. 2017 Jul 10;6:e27756. doi: 10.7554/eLife.27756

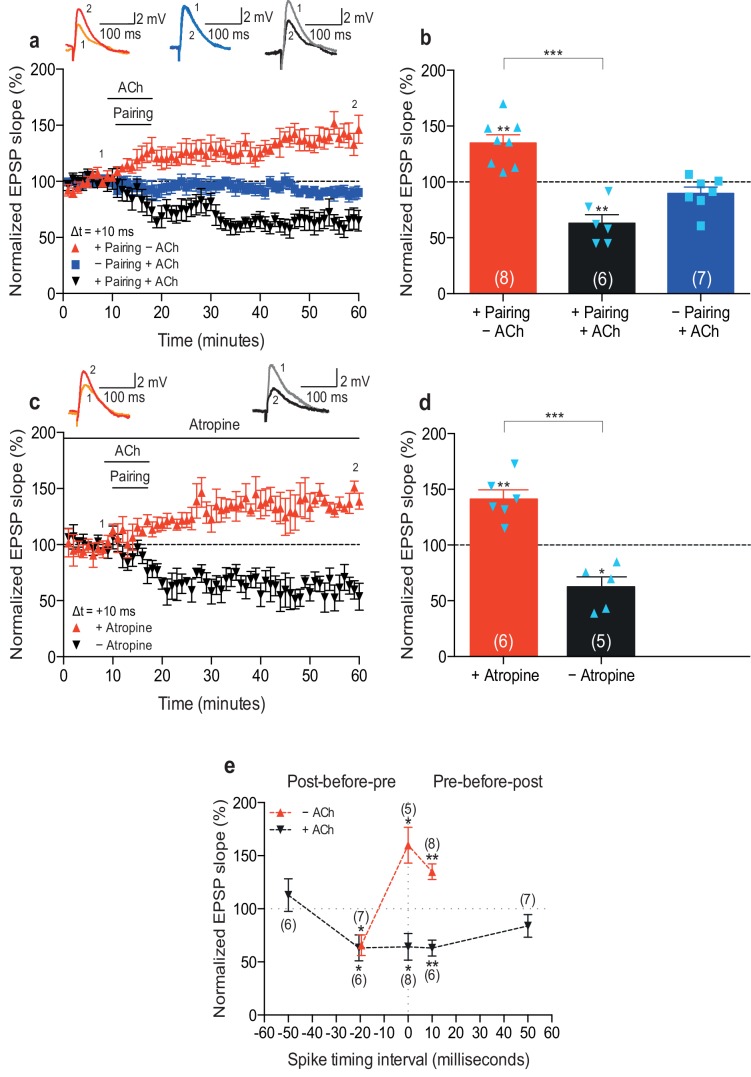
Figure 1. Acetylcholine biases STDP toward depression.

(a) In control condition, the pre-before-post pairing protocol with Δt =+10 ms induced t-LTP (red), whereas in the presence of 1 μM acetylcholine (ACh), the same pairing protocol induced t-LTD (black). In the absence of the pairing protocol, ACh had no effect on baseline EPSPs (blue). Traces show an EPSP before (1) and 40 min after pairing (2) for each condition. (b) Summary of results (mean ± s.e.m.). (c) Application of muscarinic ACh receptor antagonist, 100 nM atropine, at the beginning of the recordings prevented ACh-facilitated t-LTD (Δt =+10 ms; black) and pre-before-post pairing resulted in significant t-LTP (red). Traces are presented as in a. (d) Summary of results. (e) Summary of the STDP induction with various spike timing intervals (Δt in ms) in control condition (− ACh; red) and in the presence of ACh (+ ACh; black). Each data point is the group mean percentage change from baseline of the EPSP slope. Error bars represent s.e.m. Significant difference (*p<0.05, **p<0.01, ***p<0.001) compared with the baseline or between the indicated two groups (two-tailed Student’s t-test). The total numbers of individual cells (blue data points) are shown in parentheses.

DOI: http://dx.doi.org/10.7554/eLife.27756.002

Figure 1—source data 1. Source data for Figure 1.
DOI: 10.7554/eLife.27756.003
Figure 1—source data 2. Source data for Figure 1—figure supplement 1.
DOI: 10.7554/eLife.27756.004
Figure 1—source data 3. Source data for Figure 1—figure supplement 2.
DOI: 10.7554/eLife.27756.005

Figure 1.

Figure 1—figure supplement 1. Neuromodulation of STDP by dopamine and co-application of dopamine and acetylcholine.

Figure 1—figure supplement 1.

(a) Dopamine (DA) biases STDP toward potentiation: (ai) post-before-pre pairing protocol with Δt = −20 ms (data from Figure 1e in Brzosko et al., 2015) and (aii) pre-before-post pairing protocol with Δt =+10 ms. Traces show an EPSP before (1) and 40 min after pairing (2). (b) Co-application of DA and acetylcholine (ACh) yields depression: (bi) post-before-pre pairing protocol with Δt = −20 ms and (bii) pre-before-post pairing protocol with Δt =+10 ms produces initial synaptic depression which reverts back to baseline. Traces are presented as in a. (c) Summary of results. Each data point is the mean percentage change from baseline of the EPSP slope. Error bars represent s.e.m. Significant difference (*p<0.05, **p<0.01) compared with the baseline (two-tailed Student’s t-test). The total numbers of individual cells are shown in parentheses.

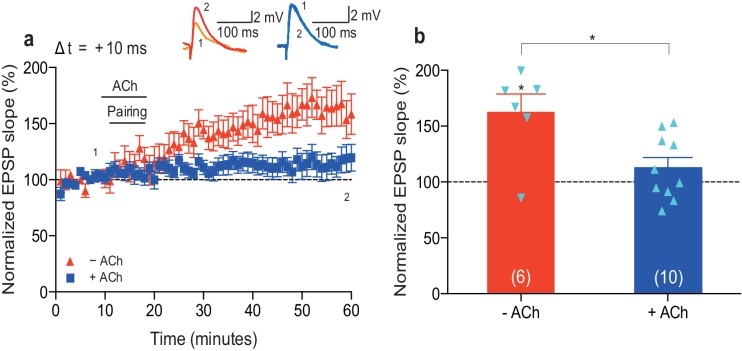
Figure 1—figure supplement 2. Low concentration of acetylcholine prevents development of t-LTP.

Figure 1—figure supplement 2.

(a) In control condition, the pre-before-post pairing protocol with Δt = +10 ms induced t-LTP (red). Application of 100 nM acetylcholine (ACh) prevented development of significant t-LTP (blue). Traces show an EPSP before (1) and 40 min after pairing (2). (b) Summary of results. Error bars represent s.e.m. Significant difference (*p<0.05) compared with the baseline or between the indicated two groups (two-tailed Student’s t-test). The total numbers of individual cells (blue data points) are shown in parentheses.