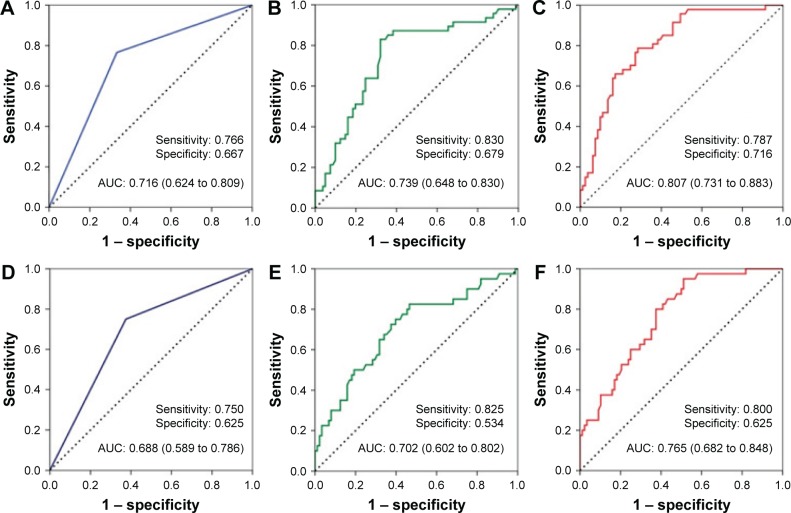
Figure 4.
ROC curve analysis for MVI and exosomal miR-125b in HCC patients (n=128; cohort 2).
Notes: ROC curves for predicting the recurrence of MVI (A), exosomal miR-125b (B), and combination of exosomal miR-125b and MVI (C). ROC curves for predicting the survival of MVI (D), exosomal miR-125b (E), and combination of exosomal miR-125b and MVI (F).
Abbreviations: MVI, microvascular invasion; HCC, hepatocellular carcinoma; AUC, area under the ROC curve.

