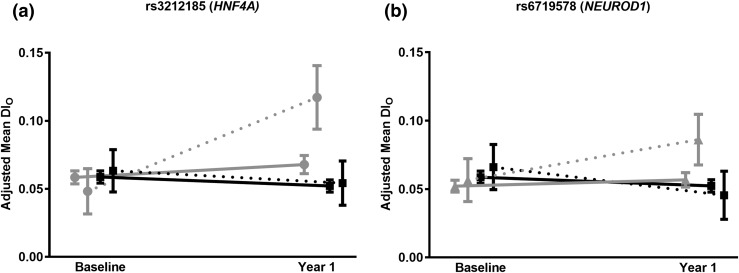
Figure 1.
SNPs in HNF4A and NEUROD1 were associated with a significant SNP × treatment interaction and insulin secretion as measured by DIo. This figure displays the adjusted means at baseline and year 1 of these SNPs comparing the two groups that demonstrated the interaction. The minor homozygotes are not shown because, due to low frequency, they were not present in all of the treatment groups. (a) rs3212185 × lifestyle (vs placebo) interaction, P value = 0.0002. TC heterozygotes (gray circle and dotted line) at SNP rs3212185 showed improved DIo after 1 year of lifestyle intervention, whereas the TT (gray circle and solid line) homozygotes had no response to lifestyle intervention. The TT and TC genotypes in the placebo group (black square) did not change in DIo. (b) rs6719578 × metformin (vs placebo) interaction, P value = 0.002. GC heterozygotes (gray triangle and dotted line) at SNP rs6719578 had improved DIo after 1 year of metformin intervention, whereas the GG (gray triangle and solid line) homozygotes did not respond to metformin intervention. Participants with the GG and GC (black square) genotypes in the placebo group did not change DIo.

