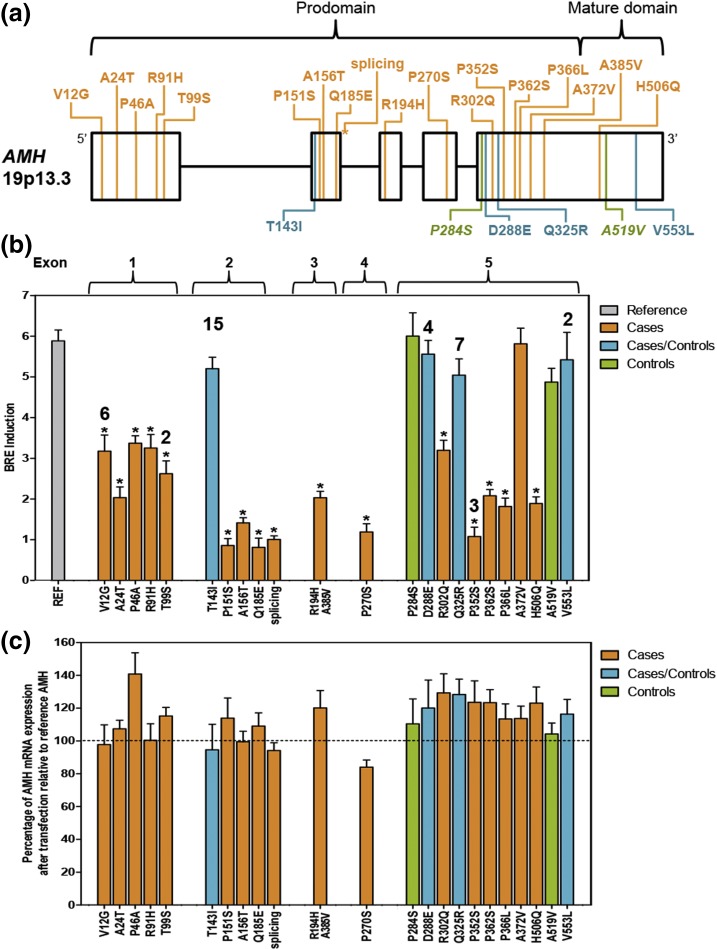
Figure 2.
Genetic variation within AMH and effects on signaling. (a) Rare (MAF < 0.01) variants identified in AMH. PCOS-specific variants are indicated in orange (n = 18). Non–PCOS-specific variants are shown in blue (n = 4), and variants present in control subjects only are shown in green (n = 2). (b) Average induction of BRE-firefly luciferase normalized to Renilla reporter and empty vector control in COS7 cells transfected with reference or variant AMH constructs. Results represent three independent experiments done in triplicate with standard error of the mean (SEM). Asterisks indicate significantly reduced BRE induction. The number of subjects (more than one) is indicated above the BRE induction bar. (c) Percentage of AMH mRNA expression for each variant after transfection relative to reference AMH. Results represent three independent experiments with qRT-PCR run in duplicate with SEM. mRNA, messenger RNA.

