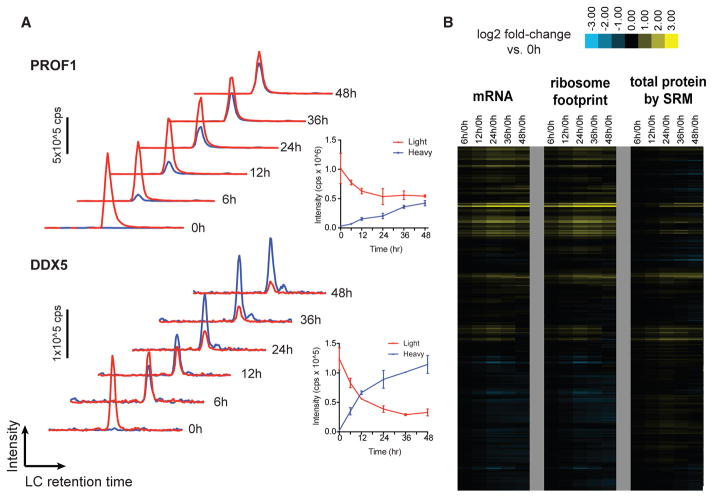
Figure 1. Direct Monitoring of Protein Synthesis by Targeted pSILAC Mass Spectrometry with Simultaneous Measurement of Transcript.
(A) Example time-course SRM data for peptides from PROF1 and DDX5. Red traces, “light” channel intensity (degraded from baseline); blue traces, “heavy” channel intensity (newly synthesized post-stable isotope pulse). Each trace represents added intensity of all monitored SRM transitions (four per peptide per channel). Inset: intensity values for each channel plotted over time; error bars reflect ±SD from replicate assays.
(B) Relative mRNA abundance and ribosome footprint read density (ratio versus 0 hr [0h], in RPKM) move together over the time course. Changes in protein abundance are not as prominent as transcript-level changes. SRM measurements of total protein here refers to the sum of all peptide intensities in light and heavy channels.

