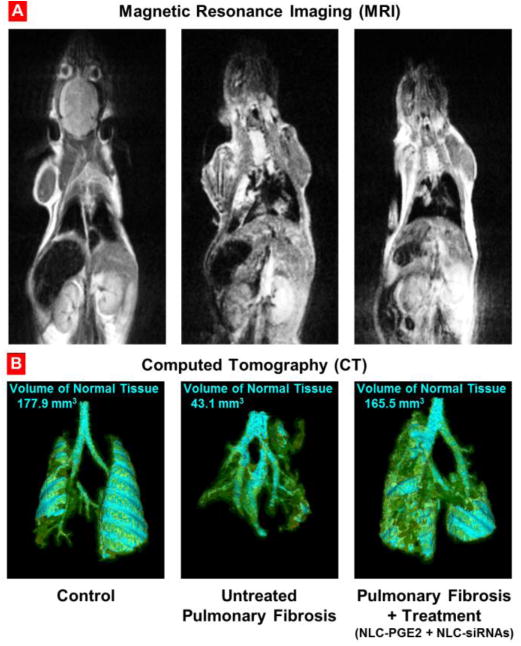
Figure 2. Development and treatment of pulmonary fibrosis.

Representative magnetic resonance (A) and computed tomography (B) images of control (healthy) mouse, untreated and treated mice with pulmonary fibrosis. Pulmonary fibrosis was induced by intratracheal instillation of 1.5 U/kg of bleomycin. Mice were treated with NLC-PGE2 and mixture of three siRNAs (MMP3, CCL12, and HIF1A) delivered by NLC twice a week for three weeks starting one day later after the bleomycin administration. Images were taken at the end of treatment. Cyan-colored areas represent normal lung tissue. Yellow color indicates normal connective tissue while green color shows fibrotic tissue that is not normally associated with lung segmentations. Areas of lung that appear to be “missing” represent dense fibrotic tissue, hemorrhage and/or edema that cannot be captured by segmentation technique applied.
