Abstract
Preterm birth is associated with brain injury and altered cognitive development. However, the consequences of extrauterine development are not clearly distinguished from perinatal brain injury. Therefore, we characterized cortical growth patterns from 30 to 46 postmenstrual weeks (PMW) in 27 preterm neonates (25–32 PMW at birth) without detectable brain injury on magnetic resonance imaging. We introduce surface‐based morphometric descriptors that quantify radial (thickness) and tangential (area) change rates. Within a tensor‐based morphometry framework, we use a temporally weighted formulation of regression to simultaneously model local age‐related changes in cortical gray matter (GM) and underlying white matter (WM) mapped onto the cortical surface. The spatiotemporal pattern of GM and WM development corresponded to the expected gyrification time course of primary sulcal deepening and branching. In primary gyri, surface area and thickness rates were below average along sulcal pits and above average on gyral banks and crests in both GM and WM. Above average surface area rates in GM corresponded to emergence of secondary and tertiary folds. These findings map the development of neonatal cortical morphometry in the context of extrauterine brain development using a novel approach. Future studies may compare this developmental trajectory to preterm populations with brain injury. Hum Brain Mapp 38:4322–4336, 2017. © 2017 Wiley Periodicals, Inc.
Keywords: MRI, preterm birth, brain mapping
AUTHOR SUMMARY
Each year, in the United States, about 1 in 10 babies are born preterm (before 37 weeks of gestation). Owing to increase in the survival rates of preterm babies, there is a growing need to understand the consequences of extrauterine brain development. Children born preterm are more likely to sustain brain injuries that affect developmental outcomes. Many studies have reported that, even when no such injuries are present, preterm birth was associated with long‐term neurodevelopmental deficits. Brain development, particularly in the third trimester, is a dynamic process with synchronous development of tissues, which is occurring in an extrauterine environment for preterm babies. Here, we present a precise time table of structural changes that occur in the gray and white matters of babies born between 25 and 32 postmenstrual weeks and imaged with magnetic resonance between 30 and 46 postmenstrual weeks. Using computational models of area and thickness changes on the surface of boundary between the gray and white matters, we describe the series of interconnected changes occurring during this critical period of brain development. In particular, we show when and where cortical folds are emerging, which are morphological hallmarks of dynamic events of cortical growth and connectivity. Disruption in this process due to extrauterine exposures may have negative outcomes. The precise timetable of cortical development presented here serves as a comparative reference to identify anomalies in preterm babies with brain injuries.
INTRODUCTION
Advances in medical care have led to increased survival rates of preterm neonates [Saigal and Doyle, 2008], which presents a need to better understand the long‐term developmental outcomes of preterm birth. As preterm neonates commonly acquire brain injuries, such as intraventricular hemorrhage or cerebellar injury, preterm brain development is often studied in the context of these injuries [Argyropoulou, 2012; Limperopoulos et al., 2010; Mathur, Neil, Inder, 2010; Tam et al., 2011]. By isolating preterm populations without injury, we recognize the potential contribution of prematurity to abnormal brain maturation [Lefèvre et al., 2015]. Many studies have reported the long‐term differences in brain development in children and adolescents born preterm, which suggest that even in the absence of visible injuries the extrauterine environment and postnatal illness alter the developmental trajectory of the preterm brain [Back and Miller, 2014; Ullman et al., 2015]. Data availability frequently limits studies of neonatal development to comparison of term‐born and term‐equivalent preterm infants (e.g. [Rose et al., 2014]) or longitudinally over fixed, wide intervals (e.g. [Moeskops et al., 2015]). Consequently, the developmental trajectory associated with the extrauterine exposure is not characterized with fine temporal resolution [Viola et al., 2011].
During the third trimester, the cortical gray matter (GM) completes lamination in concert with cortical inputs guided by the subplate. Concurrently, the subplate resolves in most regions and the tissue deep to the newly established cortex is white matter (WM) primarily of axonal tracts [Kostovic and Judaš, 2002, 2006]. However, characterization of preterm brain development by in vivo imaging methods has largely been focused on cortical GM development alone using scalar measurements of sulcal emergence [Battin et al., 1998; Dubois et al., 2008]. A few recent imaging studies provide evidence for abnormal microstructural and connectivity‐related preterm birth [Ball et al., 2013; Bonifacio et al., 2010]. Furthermore, the emergence of complex functional networks during the third trimester of development [Doria et al., 2010] indicates that there exists an interplay between the development of the cortical GM and the underlying WM. Numerical simulations and physical models that represent GM and underlying WM have shown that the mechanical process of gyrification is directed by compressive stresses on and constrained by the surface geometry of the brain [Tallinen et al., 2016]. Of particular interest is focusing the analysis of WM morphometry that is influenced by gyrification—the WM in close proximity to cortical GM. Gyrification index and surface curvature map the gyrification process at the boundary between GM and WM [Clouchoux et al., 2012; Habas et al., 2011; Lefèvre et al., 2015], yet cannot give information about the distinct morphological changes in each tissue compartment. By modeling the developmental changes in the region of this tissue boundary (i.e., the full cortical depth and a similar depth into the underlying WM), the unique and shared GM and WM morphological changes associated with gyrification may be elucidated.
In this article, we use high accuracy, manual delineation of brain tissues, derived from structural MRI, to study the spatiotemporal relationship between the sulcal and gyral development of the cortical GM and the associated changes in the underlying WM in the human preterm brain. We present a novel spatiotemporal formulation of tensor‐based morphometry (TBM), in which we characterize tissue growth in terms of radial or tangential changes across the tissue boundary. We then use a temporally weighted, local regression to create a precise timeline of local changes between the cortical GM and the underlying WM. By studying these changes in the context of postmenstrual age, we can describe the morphological relationships between the development of both layers. This allows us to model the ongoing series of interconnected changes between the adjacent tissues that result in the formation of a maturing brain in the extrauterine environment. We add to the knowledge from extant studies of preterm cortical development by mapping the sequential changes in the area and thickness of the cortical GM and underlying WM that are associated with cortical gyrification in the extrauterine environment.
MATERIALS AND METHODS
Data and Imaging
This study included 32 MRI scans (male = 16, female = 16) from 27 preterm neonates (male = 13, female = 14) selected from a prospective cohort admitted to the neonatal intensive care unit (NICU) at the British Columbia Children's Hospital, Canada [Chau et al., 2013]. This study was approved by the University of British Columbia Clinical Research Ethics Board. Informed consent was obtained from the parents prior to recruitment.
Gestational age (postmenstrual weeks, PMW) at birth ranged from 24.86 to 32.00 PMW (mean = 27.91 PMW, sd = 2.28 PMW). Gestational age at scan ranged from 27.29 to 46.43 PMW (mean = 34.53 PMW, sd = 5.58 PMW). Figure 1 shows the scan age distribution for this study. The interval from birth to scan ranged from 0.58 to 21.57 weeks (mean = 7.57 weeks, sd = 6.18 weeks). Participants included in the study had no radiologically identified abnormalities present in the image (i.e., white matter injury and obvious areas of intraventricular hemorrhage resulted in exclusion).
Figure 1.
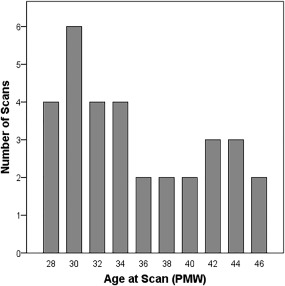
Histogram of the age at scan where x axis represents the age in postmenstrual weeks (PMW) and y axis represents the number of scans.
In this cohort, 32 T1‐weighted brain MR scans of preterm neonates were acquired using a Siemens 1.5T scanner using an MPRAGE sequence acquired using a dedicated neonatal head coil. The MR sequence parameters were as follows: repetition time (TR) = 36 ms, echo time (TE) = 9.2 ms. The images were acquired with a voxel resolution of 1.04 × 1.04 × 1 mm.
Discriminating Area and Thickness Changes Across Tissue Boundaries
The method used in this article is adapted from our previous work on studying area and thickness changes in fetal brain development [Rajagopalan et al., 2011a].
Tissue Segmentation
The 3D MR images of the brains were manually segmented into the following tissue types: cortical gray matter (GM), white matter (WM), cerebrospinal fluid (CSF), lateral and third ventricles (VENT), and deep gray matter (DG). Tissue delineations were based on the protocol previously developed by our group [Rodriguez‐Carranza et al., 2008].
Groupwise Registration
Individual brain anatomies must be spatially aligned to the same anatomical coordinates, so that they can be reliably compared across the entire population. The significant range of anatomies being studied here requires that the optimal registration method should be template‐free to avoid introducing a shape bias. To this end, we used an unbiased groupwise registration method to co‐align the tissue maps of the brains being studied [Rajagopalan et al., 2011b]. The registration method simultaneously estimates an unbiased, minimum deformation population average and diffeomorphic transformation to each of the brains being studied. The estimated average brain shape is a symmetric, minimum deformation template, where the average distance from any point on the template when mapped to the individual anatomies is zero.
The groupwise registration method was seeded with a linear registration of the WM tissue segmentations of each brain to an average WM map [Habas et al., 2010]. The method uses mean‐squared differences between the individual brain label maps (GM, WM, and CSF) and the current tissue labels (GM, WM, and CSF) as the difference metric. Dense deformation fields are computed by minimizing this difference, which are then iteratively refined using a gradient descent of the squared difference in tissue labels between the current average and each individual tissue map. This difference is then summed over each tissue class, and then minimized with respect to the displacement vector at each voxel. To ensure the spatial differentiability of the deformation fields, they were regularized using a Gaussian smoothing kernel [Modersitzki, 2004; Thirion, 1998]. The final deformation fields are a diffeomorphic composition of a three‐level, multiresolution registration scheme. The first level captures coarser shape differences (with a 3 mm Gaussian kernel) and finer differences are captured in the subsequent levels (2.5 and 2 mm kernels). The width of the kernels was chosen experimentally to ensure diffeomorphic transformations during the registration process.
From the final average template, we tessellated the boundary between the GM and WM into a surface mesh using a topology‐preserving marching cubes algorithm [Lopes and Brodlie, 2003]. This yielded a symmetric, average inner cortical surface map for the population being studied.
For each image, the Jacobian matrix maps were computed from the resulting deformation fields to quantify the pattern of deformation required to spatially normalize individual anatomies.
Computation of Surface Area and Thickness Changes
For each image, we then computed two surface Jacobian maps corresponding to the GM and WM tissue boundary. As shown in Figure 2(a), Jacobian matrices corresponding to GM tissues within 4 mm of each surface vertex were averaged (in the log domain [Arsigny et al., 2006]) and mapped onto the average inner cortical surface mesh. This provides a map of GM changes required to match each image to the population. A complementary surface Jacobian map was created for WM of each image. Figure 2(b) shows the schematic example of the hypothesized changes that occur during the formation of a gyrus.
Figure 2.
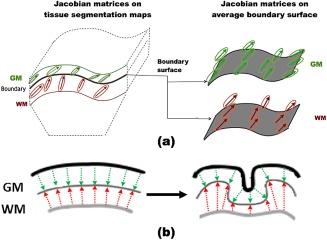
(a) Mapping Jacobian matrices to the GM and WM surface. The Jacobian matrices are computed from the deformation fields used to spatially normalize all the images. The changes on the cortical gray matter (GM) and the underlying white matter (WM) are transferred onto the boundary surface between the two tissue labels, creating a surface map of the changes on each tissue compartment. (b) 2D schematic representation of the hypothesized thickness changes that occur in each tissue compartment as cortical folding progresses. The starting point illustrated is smooth cortex in which the layers are parallel. The next line drawing shows the transformation to emerging gyri. The thickness of the GM is relatively stable at the gyral crests, and may be deformed positively or negatively along the fundus and pit of a sulcus, which is shown by the nonparallel boundaries. The underlying WM near the cortical boundary (thin gray line) does not have analogous thickness changes (in contrast to surface area change). Rather two processes are simultaneously occurring: cortical folding and regression of the subplate. Consequently, WM appears compressed at sulcal pits and maintains depth at gyri. [Color figure can be viewed at http://wileyonlinelibrary.com]
The complex changes occurring across a tissue boundary can be represented as a series of interconnected changes in area and thickness. At each location on the boundary, change in neighboring tissue area and thickness is quantified by resolving the Jacobian matrix into its radial and tangential components, respectively. We form a surface normal map (N) by computing the surface normal at each vertex of the average surface. Vertexwise approximation of change in neighboring tissue thickness , is the scalar projection of the Jacobian tensor of the tissue location projected onto the corresponding surface normal (n),
| (1) |
where is the number of brains and p is the vertex location.
Figure 3 illustrates the decomposition of the Jacobian matrix at each vertex into area and thickness measurements. To compute the change in local surface area, we compute maps of vectors tangential to the surface and perpendicular to the surface normal vector. The cross‐product of n and an arbitrary, noncolinear vector r results in one possible tangent (t1) to the surface. The other surface tangent (t2) is the cross‐product of (t1) and n. Local change in area is the scalar component of the Jacobian tensor onto t1 and t2,
| (2) |
Figure 3.

The calculation of area and thickness are shown. At every voxel, the area and thickness measurements are derived by decomposing the Jacobian tensor into its tangential and perpendicular components, respectively. [Color figure can be viewed at http://wileyonlinelibrary.com]
For each image, we computed a vertex‐wise map of surface area Ai and thickness Ti change, which was then used to analyze local changes in shape. Relative rates of change capture local variations in growth rates above or below the constant, average rate of change in the whole brain at specified ages. For example, a relative GM areal change of 105 at 40 PMW means that the local surface areal expansion is 5% greater than the average cortical areal change rate at 40 PMW. On the other hand, a relative GM areal change of 95 is 5% lower than the average cortical areal change rate at 40 PMW.
Statistical Analysis
To examine the temporal developmental patterns, we used locally weighted regression (LWR) [Cleveland et al., 1988] to model changes in local area and thickness as functions of age. LWR is a nonparametric method that fits a smooth regression model to the data by fitting simple models to localized subsets of the data. For each independent variable of interest (IVOI), a lower degree polynomial is fitted using weighted least squares, giving more weight to points near the IVOI and less weight to points further away. The regression is considered complete when a local model is fit to all independent variables. To study age‐specific models of surface shape change, we performed LWR with area (or thickness) as the dependent variable and age as the independent variable. Let Y corresponds to the vector of dependent variables (at a single vertex), X is the vector of independent variables, and ϵ are the errors. As shown in Eq. (3), for each independent variable Xi, a linear model is fit by using weighted least squares where Wi is the weight matrix. A generalized bell‐shaped function was used to form the weight matrix. LWR results in a vector of coefficients ( ) corresponding to the total number of independent variables.
| (3) |
Resulting regression coefficient ( ) maps are tested for significance using a standard t test. Statistical significance was computed and these were corrected for multiple comparisons using permutation tests [Nichols and Holmes, 2002]. The values are estimates of increase or decrease in area or thickness at a particular time point and the hypothesis tests estimate statistical significance of these changes.
For every brain, we computed a set of maps describing local changes in surface thickness and surface area for the GM and WM. For each tissue and metric, we computed a model of spatial changes from 30 to 46 PMW at 2‐week intervals.
Quantifying Regional Growth Rates
To quantitatively assess the complementary nature of GM and WM changes, we performed a secondary analysis of larger clusters of significant changes in area and thickness in both tissue compartments. We used the initial statistical analysis to identify distinct clusters of vertices with significant changes in both GM and WM at 46 PMW. Each region of interest (ROI) for area or thickness is among the five largest clusters of connected vertices that contribute to significant change. For each brain, we computed the average value of area (or thickness) within the cluster. This provided a summary statistic of how each ROI changed in area (or thickness) with respect the overall change in the brain. The summary values were plotted against the age of each brain. For each ROI, we also plotted local growth rates by using a best fit linear or nonlinear model in which relative area (or thickness) is the dependent variable and age is the independent variable. These models quantified the patterns of correlated changes between the two tissues.
RESULTS
Figure 4 shows the average, per week changes in area and thickness of the GM and WM. The absolute rate of GM surface area change peaked at 36 PMW and ranged from 0.37 to 0.42 mm2/PMW from 30 to 42 PMW; the rate declined more rapidly thereafter (Fig. 4a). Though the rate of WM area change was similar to that of GM change from 30 to 32 PMW, the WM rate steadily declined and approached zero at 46 PMW (Fig. 4a). Overall, there was a greater increase in GM surface area than in WM surface area in the preterm brains. The difference in trajectories suggests that growth of these boundary sharing tissues is not simply parallel. Where and when GM and WM maturation diverge will be described by the vertex‐wise directional TBM maps.
Figure 4.
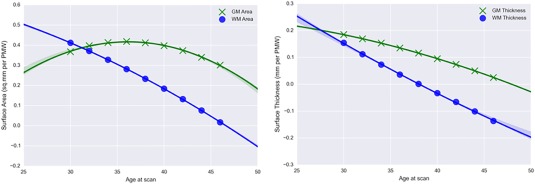
Vertex‐wise mean change in (a) surface area (mm2/PMW) and (b) surface thickness (mm/PMW) of the GM and WM from 30 to 46 gestational weeks. [Color figure can be viewed at http://wileyonlinelibrary.com]
Both GM and WM surface thickness change slowed with age (Fig. 4b). The rate of GM thickness change declined from 0.15 mm/PMW to near zero by 46 PMW, which suggests that the thickness of the cortex was either stabilizing or potentially decreasing in the neonatal period. By comparison, the rate of WM surface thickness change declined faster than that of GM and the mean WM rate became negative after 40 PMW. Negative rates signify a decrease in the rate of WM thickening compared to the overall rate, which is likely a consequence of cortical folding that compresses this tissue.
Examination of the local patterns of area and thickness age‐related change shows the significant deviations from this overall pattern of development. Reported results show relative changes in local surface area or thickness with respect to the average rate of change for that metric in cortical GM and underlying WM. For each analysis, the T Maps of statistically significant regions are overlaid on the average surface and displayed using the Rview software (http://rview.colin-studholme.net). For each map, positive local T values indicate a change in area or thickness above the average value shown in Figure 4, while negative T values are below the average value. Overall, we see distinct patterns of area and thickness changes between the GM and WM tissues. We also see complementary, temporal patterns of area and thickness change from 30 to 46 PMW.
Analysis of Changes in Surface Area
Figure 5 shows the relative changes in the surface area of the cortical GM from 30 to 46 PMW. The size and number of regions exhibiting dynamic patterns—significant deviations from the average rate—increased from 30 to 40 PMW. From 42 to 46 PMW, smaller and fewer regions significantly differed from the average rate, suggesting more uniform growth during this latter period. The formation or deepening of sulci was indicated by lower rates; for example, the full lengths of the central sulcus (36–46 PMW), parieto‐occipital fissure (38–46 PMW), and calcrine sulcus (34–44 PMW) show this pattern. Segments of the postcentral (34–46 PMW), intraparietal (34–46 PMW), superior temporal (30–46 PMW), and calloso‐marginal (42–46 PMW) sulci also had less than average rates in GM. However, not all sulcal regions had lesser rates. Regions spanning over multiple gyri, such as the lateral surface of the frontal cortex (30–46 PMW) and medial surface of the parietal cortex (34–46 PMW), had greater than average rates of GM area change that may be due to simultaneous lateral expansion of cortex and cortical folding.
Figure 5.
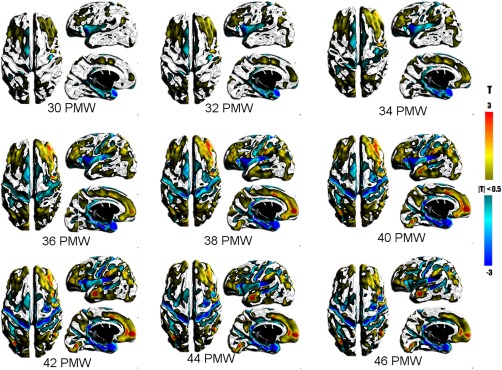
T maps showing statistically significant changes in the surface area of the cortical GM. Warm colors represent greater than average changes while cool colors represent lower than average changes in area. [Color figure can be viewed at http://wileyonlinelibrary.com]
The large expanse of lesser rates included the insular and opercular regions and the superior surface of the temporal cortex and medial aspect of the entorhinal cortex and hippocampal formation. The changes in the insula and operculum are likely associated with opercularization that completes near term, in which these tissues are being compressed into a relatively smaller space. The relative lesser rate in the medial temporal lobe may have occurred because these gray matter structures develop on a very different trajectory than neocortex which begins earlier and extends later. In addition, the distinction between GM and WM in this region is obscured by the hippocampus and amygdala. Lower than average rates were also present in the GM thickness of the medial temporal lobe (Fig. 7).
Figure 7.
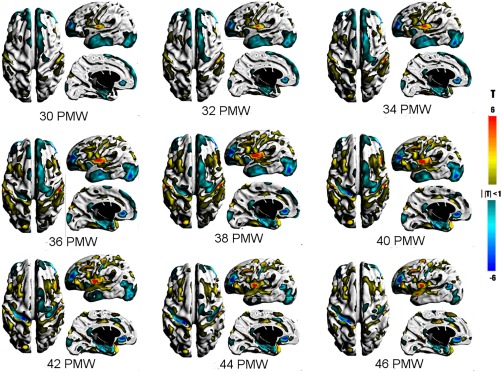
T maps showing statistically significant changes in surface thickness of the cortical GM. Warm colors represent greater than average changes while cool colors represent lower than average changes in thickness. [Color figure can be viewed at http://wileyonlinelibrary.com]
Figure 6 shows the relative changes in the surface area of the underlying WM from 30 to 46 PMW. Underlying WM surface area age‐related patterns were largely complementary to that of cortical GM. The greatest period of dynamic growth was between 38 and 40 PMW like GM, but tapered off more rapidly thereafter. Greater than average WM rates were detected along gyral crests and banks (e.g., superior and middle frontal gyri), but not sulci pits (e.g., superior frontal sulcus). Notable gyri include the precentral (30–46 PMW), postcentral (30–46 PMW), inferior frontal (30–46 PMW), supramarginal (30–46 PMW), and middle temporal (30–42 PMW). The changes in WM and GM area in the inferior frontal gyrus are likely due to cortical folding that results in the orbital, triangular, and opercular parts, which emerge in the third trimester.
Figure 6.
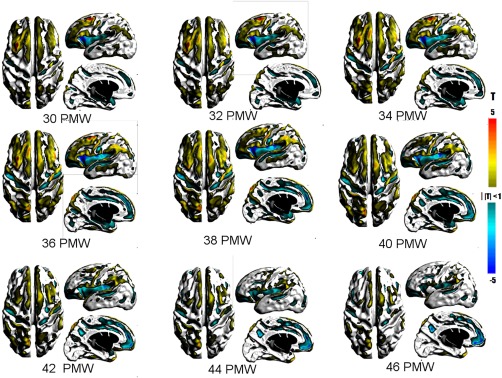
T maps showing statistically significant changes in the surface area of the underlying WM underlying the cortical GM. Warm colors represent greater than average changes while cool colors represent lower than average changes in area. [Color figure can be viewed at http://wileyonlinelibrary.com]
Lower than average areal rates in WM were almost exclusively in sulcal regions, as WM is being compressed in the process of cortical folding. This was seen in the same sulci as found in GM though significant regions are larger. In addition, lesser rates were also present in regions that have greater than average GM area rates, such as medial aspect of the superior frontal gyrus (30–46 PMW) and paracentral sulcus in the medial parietal lobe (38–46 PMW). These discordant directions may be associated by emergence of secondary or tertiary folds of these major gyri.
Analysis of Changes in Surface Thickness
Figure 7 shows the relative changes in the local thickness of the cortical GM from 30 to 46 PMW. Greater than average rates were consistently found about the edges of gyral crests that had greater than average areal change (e.g., posterior middle frontal gyrus, orbital part of inferior frontal gyrus, precentral gyrus, cingulate gyrus, and middle temporal gyrus). The greater increases at this early developmental stage may be correlated with the relative difference in absolute cortical thickness along the cortical surface (gyral crest, fundus, and sulcus). Modeling of nonhuman primate cortex suggest mechanical stress due to axonal tension during cortical development drives these variations in absolute cortical thickness [Hilgetag and Barbas, 2006, 2005]. Similarly, the greater rates in the insula may be linked to secondary folding of this GM.
In contrast to gryal regions with greater than average rates, broad areas of lesser rates were identified on the lateral occipital cortex (30–46 PMW) and lateral temporal cortex (30–42 PMW). The significant deviation from average in these regions may be a consequence of the relatively early and later development of occipital and temporal cortices, respectively. Lower than average rates were also observed at the superior frontal gyrus (30–42 PMW) and anterior middle frontal gyrus (30–46 PMW). The lesser rates along the interhemispheric fissure, which were also observed in GM area, may be associated with mechanical limitations of the opposing hemispheres. GM thickness rates were lower than average in limited sulci, which were the central (34–46 PMW), anterior internal frontal (30–46 PMW), and cuneus which may be associated with emergence, deepening, or branching of sulci.
Figure 8 shows the relative changes in the local thickness of the underlying WM from 30 to 46 PMW. Relatively greater change in WM thickness was detected along the banks and crests of gyri in a spatiotemporal pattern matching the GM in most regions (e.g., lateral frontal region, middle temporal gyrus, lateral occipital region, and insula). The medial frontal region showed a very different pattern. Greater rates of WM thickness changes were detected on the medial aspect of the superior frontal gyrus (34–46 PMW). This difference may result from less constraint on WM tissue by the interhemispheric fissure compared to that on GM. While the average rate of WM thickness change decreased and became negative after 40 PMW, significantly lesser than average rates were found at only some sulci (e.g., central sulcus, intralingual sulcus, subparietal sulcus). This shows that negative thickness changes associated with cortical folding are relatively uniform for this developmental period and only limited sulci are emerging or deepening more rapidly.
Figure 8.
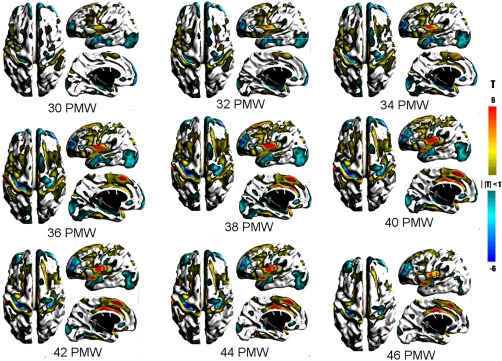
T maps showing statistically significant changes in surface thickness of the underlying WM underlying the cortical GM. Warm colors represent greater than average changes while cool colors represent lower than average changes in thickness. [Color figure can be viewed at http://wileyonlinelibrary.com]
Complementary Patterns in Gray and White Matter
Figures 9i and 10g show the regions of common GM and WM significant area and thickness changes, respectively. The associated plots demonstrate the age range that showed complementary relative change rate. For example, in right and left occipital cortex (Figure 10e–f), GM and WM thicknesses both increased steadily until approximately 38 PMW. Thereafter, GM thickness continued to show relative increases on average; whereas, WM thickness showed a relative decreases. This difference was evident in the vertex‐wise statistical maps in which regions of significant positive thickness change were present at 40 PMW onward in GM, but not WM. The transitory complementarity in area was well illustrated by the central sulcus (Figure 9f,h). While the relative rates for GM and WM area overlapped up to 40 PMW, the relative rate of GM area change then declined resulting in an estimated trajectory likened to an inverted U. This pattern matched the time course of the vertex‐wise significance maps (Figures 5 and 6), whereby the relative area change rate over the full length of the central sulcus region remained significantly negative in GM, but not WM, from 42 to 46 PMW. By comparison of independent GM and WM maps (Figures 5, 6, 7, 8) and by quantifying relative rates over shared regions, complementary spatiotemporal patterns of GM and WM relative area and thickness changes were recognized.
Figure 9.
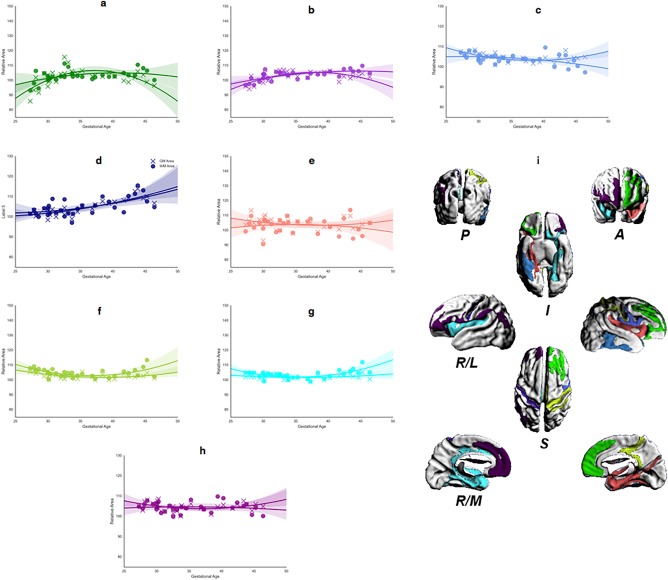
Regional analysis of area changes for the largest contiguous cluster of vertices. (a–h) Mean area change, in GM (cross) and WM (circle), calculated for each significant ROI, for all brains mapped against age at scan. Each panel shows the best‐fit model against age for each ROI (WM, solid; GM, dashed): (i) shows 3D surface representations of significant ROIs. The direction legends are the following: R, right; L, lateral; M, medial; S, superior; I, inferior; A, anterior; P, posterior. The color of each ROI corresponds to the color used for the growth rate plot lines (a–h). [Color figure can be viewed at http://wileyonlinelibrary.com]
Figure 10.
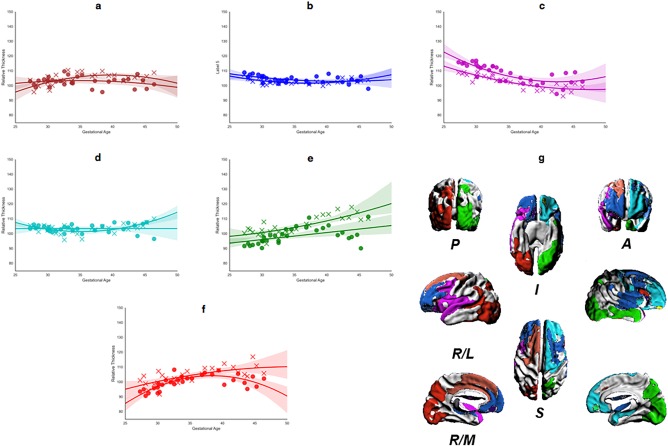
Regional analysis of thickness changes for the largest contiguous cluster of vertices. (a–f) Mean thickness change, in GM (cross) and WM (circle), calculated for each significant ROI, for all brains mapped against age at scan. Each panel shows the best‐fit model against age for each ROI (WM, solid; GM, dashed): (g) shows the 3D surface representations of significant ROIs. The direction legends are as follows: R, right; L, lateral; M, medial; S, superior; I, inferior; A, anterior; P, posterior. The color of each ROI corresponds to the color used for the growth rate plot lines (a–f). [Color figure can be viewed at http://wileyonlinelibrary.com]
DISCUSSION
This study presents the temporally specific maps of changes in radial and tangential growth of the cortical GM and underlying WM in preterm infants between 30 and 46 PMW. Spatial patterns in these tissues are obtained using quantitative measurements of area and thickness changes mapped to a common reference space from brains with different gestational ages. Using these measurements in temporally weighted statistical tests, we were able to accurately illustrate the sequences of morphometric changes that occur in the development of a preterm human cortex.
Developmental Processes
Leading up to the developmental period studied here (30 PMW), migrating neurons pass through and taxi in the superficial subplate, which is a tissue in the WM label, prior to settling in the cortex. During the late third trimester, these neurons complete their migration to the superficial layers of the cortical GM [Kostović and Judaš, 2002]. This process of migration and lamination likely contributes to the overall increase in thickness that occurs prior to term age. Greater than average increases in thickness were observed along the banks of primary gyri (e.g., inferior frontal gyrus), which was likely a consequence of secondary folding that increased the curvature along the length of sulci [Habas et al., 2011]. Therefore, we saw changes in thickness associated with both cortical lamination and mechanical gyrification processes.
Intertwined with changes in the cortical GM are changes in the subplate of the underlying WM. The prominence of the subplate peaks between 30 and 32 PMW and its dissolution accelerates after 36 PMW at variable paces across the cortex. In particular, during the gyrification process, the superficial subplate deep to gyral crests is sustained for longer periods than at the sulci [Kostović and Judaš, 2002], which we observed through thickness and area changes in WM, such as in WM surrounding the central and superior temporal sulci.
Increases in cortical surface area in the fetal and neonatal periods are the summation of neuronal differentiation, dendritic outgrowth, and afferent ingrowth [Kostović and Judaš, 2002]. While the first two processes are contained within the cortical GM, afferent ingrowth is modulated by the subplate, particularly thalamocortical input [Kostovic and Judaš, 2006]. We show complementary spatiotemporal patterns in areal change rates in both GM and WM in most cortical regions on the lateral surface, which may be indicative of the coordinated maturation of both tissues during a period of rapid axonal projection into cortex. The apparent discordant patterns on the medial surface may be associated with mechanical constraints of the interhemispheric fissure.
Comparison to Imaging Studies
Our findings show that between 30 and 46 PMW, the preterm brain continues to grow in both size and complexity. A recent DTI study reported that the most rapid cortical development, as measured by FA, during this period occurred at the frontal and temporal poles and parietal cortex [Ball et al., 2013]. In contrast, we did not detect a demonstrable lobar spatiotemporal pattern by cortical surface area or thickness. Rather, the variations in rates were more closely related to cortical folding, which was also observed in this study (i.e., higher rates of FA change in gyri compared to sulci). Directional TBM, however, cannot resolve microstructural properties that underlie the morphometric change since the information is limited to volumetric properties. For example, compression of WM may either be representative of thinning subplate or compaction of axonal tracts.
In the third trimester of gestation, cortical development is characterized by more prominent increases in surface area than thickness as a result of dendritic arborization in the cortex [Bystron et al., 2008]. However, variations in the rate of GM thickness changes were expansive, which may lead to the heterogeneity in absolute cortical thickness reported in neonates and infants [Li et al., 2015]. From 30 PMW onwards, the primary sulci are established, yet continue to increase in depth and morphological complexity. We noticed a number of significant regions with variable rates that indicate branching associated with the emergence of the secondary sulci. For example, more rapid changes in both area and thickness of the inferior frontal gyrus are indicative of the emergence of the opercular, triangular, and orbital parts of this gyrus [Garel et al., 2001].
During the third trimester and neonatal periods, the cerebral wall undergoes a dynamic transformation from transient fetal tissues, like the subplate, to white matter tracts. This has been recently illustrated by both histological techniques [Kostović et al., 2014] and by analysis of structural and functional connectivity [van den Heuvel et al., 2014] of the preterm neonate. In preterm neonates imaged at 30 and 40 PMW, structural–functional coupling and intra‐ and interhemispheric functional connectivity increased over this period [van den Heuvel et al., 2014]. This finding is in line with the histological studies that show development of callosal and corticocortical tracts [Kostović et al., 2014]. Our study adds a layer of understanding by mapping the morphometric changes associated with the emergence of cortical connectivity. For example, concurrent relative areal expansions may indicate accelerated periods of afferent in growth (increase in WM and GM) and cortical synpatogensis (increase in GM). This was observed in multiple regions, including the superior and middle frontal gyri, and precentral and postcentral gyri. Thus far, microsturctural and connectivity MRI studies of the preterm neonate have not characterized the development of the cerebral wall with the anatomical and temporal specificity provided by vertex‐wise morphological analyses. A multimodal approach to modeling these developmental processes is thus needed.
Of particular interest is whether extrauterine brain development in the preterm neonate significantly deviates from a term‐born neonate [Lefèvre et al., 2015]. Previous diffusion imaging studies of preterm WM and GM microstructure have demonstrated less mature networks and tissues at term‐equivalent age, which was correlated with gestational age at birth [Ball et al., 2013; Broekman et al., 2014; Pannek et al., 2013]. For example, Pannek et al. (2013) showed reduced FA in a frontal lobe network at term‐equivalent age and our results show rapid areal expansion in similar regions in both GM and WM, especially between 32 and 36 PMW for WM. By mapping where peak changes are occurring along the boundary of the cortex and white matter throughout extrauterine brain development, regions of selective vulnerability may be identified. We put forth biweekly maps of preterm cortical development that may be referenced for studies with scans only in the term‐equivalent age range.
Recent studies of preterm brain morphology give additional insights into vulnerable brain regions. In a study with similar age range, GM and WM surface area was affected by prematurity primarily in the anterior temporal and medial‐inferior temporal cortex [Makropoulos et al., 2016]. Using novel metrics to assess cortical folding, Lefèvre et al. [2015] showed that compared to term born infants, term‐equivalent preterm infants had reduced lateral surface area, gyrifcation index, and curvedness. A longitudinal study at 30 and 40 PMW indicated that brain injury had a significant impact on gyrfication index and surface area at 40 PMW [Moeskops et al., 2015]. Future studies using the directional TBM in a comparison term group may further describe these effects of prematurity and associated brain injuries in the context of local area and thickness of complementary GM and WM.
Comparison to Scalar TBM Models
Figure 11 shows an overview of the major changes detected in the same population when using scalar, volume‐based TBM [Rajagopalan et al., 2011] alone. The scalar TBM methods capture a number of the same changes as the spatiotemporal morphometry method; particularly those associated with the process of cortical folding. Significant regions of greater than average increases are constrained to regions near the surface, which is effectively cortical GM. Sulcal changes detected by scalar TBM from 30 to 46 PMW were identified at the superior and inferior frontal, cingular, superior temporal, lateral occipito‐temporal, precentral, central, postcentral, and intraparietal sulci. Additionally, isolated regions not associated with primary sulci were detected across the cortex (e.g., temporal pole). Unlike the spatiotemporal morphometry analysis, this method does not capture the dynamic changes occurring at the gyral crests (e.g., pre‐ and postcentral gyri, frontal gyri, and temporal gyri). Scalar TBM also does not capture the relative decrease in the growth rate of underlying WM surrounding the operculum and insula, which is prominent in the surface area maps (Fig. 6). Scalar TBM is unable to identify the correlative changes between the GM and WM associated with the evolution of the boundary between them. In large regions with uniform tissue contrast such as in the WM, scalar TBM cannot localize changes to specific tissues. Tissue changes observed in such regions correspond to large changes in the surrounding tissue boundaries as captured by the regularization of the deformation fields during registration. Hence, patterns of volume increases or decreases deep within the WM regions should be interpreted with caution.
Figure 11.
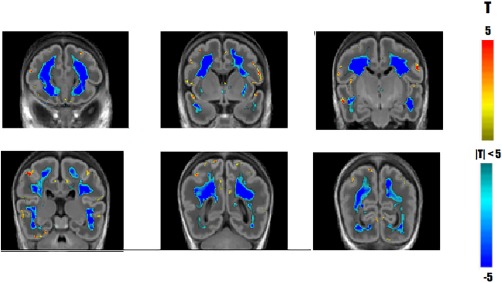
Comparing spatiotemporal TBM with scalar, volume‐based TBM. Significant changes in growth rate detected using scalar TBM. Yellow and red areas indicate regions growing faster than the supratentorial growth rate while blue indicate regions growing slower than the overall growth rate. Coronal sections displayed anterior to posterior at 12 mm increments. [Color figure can be viewed at http://wileyonlinelibrary.com]
While scalar TBM is a powerful, open‐ended tool that allows for the characterization of broad changes occurring in population being studied, our spatiotemporal morphometry method was developed expressly for the purpose of modeling the growth of cortical sheet with its unique characteristics. It was designed to function as a hybrid that allowed for measurement of dynamic changes between two adjacent tissues and for the visualization of those changes on a surface representation of the boundary between them.
LIMITATIONS
Previous work has demonstrated a negative developmental effect of gestational age at birth on measures of cortical maturation [Ball et al., 2013; Broekman et al., 2014; Pannek et al., 2013]. In this analysis, we did not adjust for gestational age at birth, which was very preterm (25–32 PMW) and the scan interval was highly variable. It is possible, that duration of extrauterine exposure and degree of prematurity influenced the calculations of mean rates of surface area and thickness changes in GM and WM (Fig. 4). Although the exact values of the rates of or expansion could vary, the overall relative, spatiotemporal patterns of change would remain robust to this effect as the model looks for population‐wide changes as opposed to individual changes. Also, to study population‐wide changes due to prematurity our trajectories are based on a cross‐sectional sample. Our dataset includes 5 subjects who were imaged twice. Our nonparametric statistical method is designed to minimize the impact of the repeated time points on each other. We randomly removed one of the two time points for each subject with repeated scans and recalculated the ROI models (similar to Figs. 9 and 10). Supporting Information, Figures 1 and 2 show the area and thickness curves after removing the repeated time point, respectively. Our results demonstrate that our models are not affected by repeating some of the subjects.
Our method is unable to resolve the absolute rates for each vertex. Thus, a rate significantly lower, as compared with an average rate which is positive, could be either less positive or even negative. Therefore, changes occurring at a specific location can only be interpreted with respect to the overall average change in that structure at any given time point.
CONCLUSION
In this study, we present a statistical map of the radial and areal changes in cortical GM and underlying WM development of the preterm human brain between 30 and 46 PMW. This spatiotemporal model mapped the differential patterns of development between these two tissues during the third‐trimester equivalent and the neonatal period. For the first time, using our proposed method, we were able to quantitatively establish patterns of synchrony in the development of the GM and WM associated with cortical folding including and beyond primary gryogenesis. This created a baseline map of cortical development in healthy, preterm infants with which to identify divergent development in the presence of brain insults.
Supporting information
Supporting Information
ACKNOWLEDGEMENTS
SPM is currently the Bloorview Children's Hospital Chair in Pediatric Neuroscience and was supported by a Tier 2 Canada Research Chair in Neonatal Neuroscience, and Michael Smith Foundation for Health Research Scholar. We thank Drs Ruth Grunau and Anne Synnes for their detailed follow‐up of this cohort to determine neurodevelopmental outcomes for defining the cohort reported here.
REFERENCES
- Saigal S, Doyle LW (2008): An overview of mortality and sequelae of preterm birth from infancy to adulthood. Lancet 371:261–269. [DOI] [PubMed] [Google Scholar]
- Mathur AM, Neil JJ, Inder TE (2010): Understanding brain injury and neurodevelopmental disabilities in the preterm infant: The evolving role of advanced magnetic resonance imaging. Semi Perinatol 34:57–66. [DOI] [PMC free article] [PubMed] [Google Scholar]
- Argyropoulou, M.I. (2012) Hemorrhage, stroke, and ischemia of the neonatal brain, in Diseases of the Brain, Head & Neck, Spine 2012–2015. Springer; pp 263–267. [Google Scholar]
- Limperopoulos C, Chilingaryan G, Guizard N, Robertson RL, Du Plessis AJ (2010): Cerebellar injury in the premature infant is associated with impaired growth of specific cerebral regions. Pediatr Res 68:145–150. [DOI] [PubMed] [Google Scholar]
- Tam EW, Miller SP, Studholme C, Chau V, Glidden D, Poskitt KJ, Ferriero DM, Barkovich AJ (2011): Differential effects of intraventricular hemorrhage and white matter injury on preterm cerebellar growth. J Pediatr 158:366–371. [DOI] [PMC free article] [PubMed] [Google Scholar]
- Lefèvre J, Germanaud D, Dubois J, Rousseau F, de Macedo Santos I, Angleys H, Mangin JF, Hüppi PS, Girard N, De Guio F (2015): Are developmental trajectories of cortical folding comparable between cross‐sectional datasets of fetuses and preterm newborns? Cereb Cortex bhv123. [DOI] [PubMed] [Google Scholar]
- Back SA, Miller SP (2014): Brain injury in premature neonates: A primary cerebral dysmaturation disorder. Ann Neurol 75:469–486. [DOI] [PMC free article] [PubMed] [Google Scholar]
- Ullman H, Spencer‐Smith M, Thompson DK, Doyle LW, Inder TE, Anderson PJ, Klingberg T (2015): Neonatal MRI is associated with future cognition and academic achievement in preterm children. Brain 138:3251–3262. [DOI] [PMC free article] [PubMed] [Google Scholar]
- Rose J, Vassar R, Cahill‐Rowley K, Guzman XS, Hintz SR, Stevenson DK, Barnea‐Goraly N (2014): Neonatal physiological correlates of near‐term brain development on MRI and DTI in very‐low‐birth‐weight preterm infants. NeuroImage Clin 5:169–177. [DOI] [PMC free article] [PubMed] [Google Scholar]
- Moeskops P, Benders MJ, Kersbergen KJ, Groenendaal F, de Vries LS, Viergever MA, Išgum I (2015): Development of cortical morphology evaluated with longitudinal MR brain images of preterm infants. PLoS One 10:e0131 552. [DOI] [PMC free article] [PubMed] [Google Scholar]
- Viola A, Confort‐Gouny S, Schneider J, Le Fur Y, Viout P, Chapon F, Pineau S, Cozzone P, Girard N (2011): Is brain maturation comparable in fetuses and premature neonates at term equivalent age? Am J Neuroradiol 32:1451–1458. [DOI] [PMC free article] [PubMed] [Google Scholar]
- Kostovic I, Judaš M (2006): Prolonged coexistence of transient and permanent circuitry elements in the developing cerebral cortex of fetuses and preterm infants. Dev Med Child Neurol 48:388–393. [DOI] [PubMed] [Google Scholar]
- Kostović I, Judaš M (2002): Correlation between the sequential ingrowth of afferents and transient patterns of cortical lamination in preterm infants. Anat Record 267:1–6. [DOI] [PubMed] [Google Scholar]
- Dubois J, Benders M, Cachia A, Lazeyras F, a Vinh Leuchter R, Sizonenko S, Borradori‐Tolsa C, Mangin J, Huppi P (2008): Mapping the early cortical folding process in the preterm newborn brain. Cereb Cortex 18:1444–1454. [DOI] [PubMed] [Google Scholar]
- Battin MR, Maalouf EF, Counsell SJ, Bsc D, Herlihy AH, Rutherford MA, Azzopardi D, Edwards AD (1998): Magnetic resonance imaging of the brain in very preterm infants: Visualization of the germinal matrix, early myelination, and cortical folding. Pediatrics 101:957–962. [DOI] [PubMed] [Google Scholar]
- Ball G, Srinivasan L, Aljabar P, Counsell SJ, Durighel G, Hajnal JV, Rutherford MA, Edwards AD (2013): Development of cortical microstructure in the preterm human brain. Proc Natl Acad Sci 110:9541–9546. [DOI] [PMC free article] [PubMed] [Google Scholar]
- Bonifacio SL, Glass HC, Chau V, Berman JI, Xu D, Brant R, Barkovich AJ, Poskitt KJ, Miller SP, Ferriero DM (2010): Extreme premature birth is not associated with impaired development of brain microstructure. J Pediatr 157:726–732. [DOI] [PMC free article] [PubMed] [Google Scholar]
- Doria V, Beckmann CF, Arichi T, Merchant N, Groppo M, Turkheimer FE, Counsell SJ, Murgasova M, Aljabar P, Nunes RG, et al (2010): Emergence of resting state networks in the preterm human brain. Proc Natl Acad Sci 107:20 015–20 020 [DOI] [PMC free article] [PubMed] [Google Scholar]
- Tallinen T, Chung JY, Rousseau F, Girard N, Lefèvre J, Mahadevan L (2016): On the growth and form of cortical convolutions. Nat Phys. [Google Scholar]
- Habas PA, Scott JA, Roosta A, Rajagopalan V, Kim K, Rousseau F, Barkovich AJ, Glenn OA, Studholme C (2011): Early folding patterns and asymmetries of the normal human brain detected from in utero MRI. Cereb Cortex 22:13–25. [DOI] [PMC free article] [PubMed] [Google Scholar]
- Clouchoux C, Kudelski D, Gholipour A, Warfield SK, Viseur S, Bouyssi‐Kobar M, Mari JL, Evans AC, Du Plessis AJ, Limperopoulos C (2012): Quantitative in vivo MRI measurement of cortical development in the fetus. Brain Struct Funct 217:127–139. [DOI] [PubMed] [Google Scholar]
- Chau V, Synnes A, Grunau RE, Poskitt KJ, Brant R, Miller SP (2013): Abnormal brain maturation in preterm neonates associated with adverse developmental outcomes. Neurology 81:2082–2089. [DOI] [PMC free article] [PubMed] [Google Scholar]
- Rajagopalan V, Scott J, Habas P, Kim K, Rousseau F, Glenn O, Barkovich A, Studholme C (2011a): Spatiotemporal morphometry of adjacent tissue layers with application to the study of sulcal formation In: Fichtinger G, Martel A, Peters T, editors. Medical Image Computing and Computer‐Assisted Intervention, Lecture Notes in Computer Science, Vol. 6892 pp 476–483. [DOI] [PMC free article] [PubMed] [Google Scholar]
- Rodriguez‐Carranza CE, Mukherjee P, Vigneron D, Barkovich J, Studholme C (2008): A framework for in vivo quantification of regional brain folding in premature neonates. Neuroimage 41:462–478. [DOI] [PMC free article] [PubMed] [Google Scholar]
- Rajagopalan V, Scott JA, Habas PA, Corbett‐Detig JM, Kim K, Rousseau F, Barkovich AJ, Glenn OA, Studholme C (2011b): Local tissue growth patterns underlying normal fetal human brain gyrification quantified in utero. J Neurosci 31:2878–2887. [DOI] [PMC free article] [PubMed] [Google Scholar]
- Habas PA, Kim K, Corbett‐Detig JM, Rousseau F, Glenn OA, Barkovich AJ, Studholme C (2010): A spatiotemporal atlas of MR intensity, tissue probability and shape of the fetal brain with application to segmentation. Neuroimage 53:460–470. [DOI] [PMC free article] [PubMed] [Google Scholar]
- Thirion JP (1998): Image matching as a diffusion process: An analogy with maxwell's demons. Med Image Anal 2:243–260. [DOI] [PubMed] [Google Scholar]
- Modersitzki J (2004): Numerical methods for image registration.
- Lopes A, Brodlie K (2003): Improving the robustness and accuracy of the marching cubes algorithm for isosurfacing. Visual Comp Graphics IEEE Trans 9:16–29. [Google Scholar]
- Arsigny, V. , Commowick, O. , Pennec, X. , and Ayache, N. (2006) A log‐euclidean framework for statistics on diffeomorphisms, in Medical Image Computing and Computer‐Assisted Intervention MICCAI 2006, Lecture Notes in Computer Science, vol. 4190 (eds Larsen R., Nielsen M., and Sporring J.), Berlin, Heidelberg: Springer; pp 924–931. [DOI] [PubMed] [Google Scholar]
- Cleveland WS, Devlin SJ, Grosse E (1988): Regression by local fitting: Methods, properties, and computational algorithms. J Economet 37:87– 114. [Google Scholar]
- Nichols TE, Holmes AP (2002): Nonparametric permutation tests for functional neuroimaging: A primer with examples. Hum Brain Mapp 15:1–25. [DOI] [PMC free article] [PubMed] [Google Scholar]
- Hilgetag CC, Barbas H (2006): Role of mechanical factors in the morphology of the primate cerebral cortex. PLoS Comput Biol 2:e22. [DOI] [PMC free article] [PubMed] [Google Scholar]
- Hilgetag CC, Barbas H (2005): Developmental mechanics of the primate cerebral cortex. Anat Embryol 210:411–417. [DOI] [PubMed] [Google Scholar]
- Bystron I, Blakemore C, Rakic P (2008): Development of the human cerebral cortex: Boulder committee revisited. Nat Rev Neurosci 9:110–122. [DOI] [PubMed] [Google Scholar]
- Li G, Lin W, Gilmore JH, Shen D (2015): Spatial patterns, longitudinal development, and hemispheric asymmetries of cortical thickness in infants from birth to 2 years of age. J Neurosci 35:9150–9162. [DOI] [PMC free article] [PubMed] [Google Scholar]
- Garel C, Chantrel E, Brisse H, Elmaleh M, Luton D, Oury JF, Sebag G, Hassan M (2001): Fetal cerebral cortex: Normal gestational landmarks identified using prenatal MR imaging. Am J Neuroradiol 22:184–189. [PMC free article] [PubMed] [Google Scholar]
- Kostović I, Jovanov‐Milošević N, Radoš M, Sedmak G, Benjak V, Kostović‐Srzentić M, Vasung L, Čuljat M, Radoš M, Hüppi P, et al (2014): Perinatal and early postnatal reorganization of the subplate and related cellular compartments in the human cerebral wall as revealed by histological and MRI approaches. Brain Struct Funct 219:231–253. [DOI] [PubMed] [Google Scholar]
- van den Heuvel MP, Kersbergen KJ, de Reus MA, Keunen K, Kahn RS, Groenendaal F, de Vries LS, Benders MJ (2014): The neonatal connectome during preterm brain development. Cereb Cortex bhu095. [DOI] [PMC free article] [PubMed] [Google Scholar]
- Pannek K, Hatzigeorgiou X, Colditz PB, Rose S (2013): Assessment of structural connectivity in the preterm brain at term equivalent age using diffusion MRI and t2 relaxometry: A network‐based analysis. PLoS One 8:e68 593. [DOI] [PMC free article] [PubMed] [Google Scholar]
- Broekman BF, Wang C, Li Y, Rifkin‐Graboi A, Saw SM, Chong YS, Kwek K, Gluckman PD, Fortier MV, Meaney MJ, et al (2014): Gestational age and neonatal brain microstructure in term born infants: A birth cohort study. PLoS One 9:e115 229. [DOI] [PMC free article] [PubMed] [Google Scholar]
- Makropoulos A, Aljabar P, Wright R, Hüning B, Merchant N, Arichi T, Tusor N, Hajnal JV, Edwards AD, Counsell SJ, et al (2016): Regional growth and atlasing of the developing human brain. Neuroimage 125:456–478. [DOI] [PMC free article] [PubMed] [Google Scholar]
Associated Data
This section collects any data citations, data availability statements, or supplementary materials included in this article.
Supplementary Materials
Supporting Information


