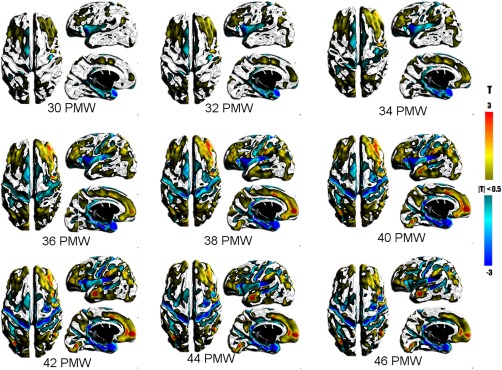
Figure 5.

T maps showing statistically significant changes in the surface area of the cortical GM. Warm colors represent greater than average changes while cool colors represent lower than average changes in area. [Color figure can be viewed at http://wileyonlinelibrary.com]
