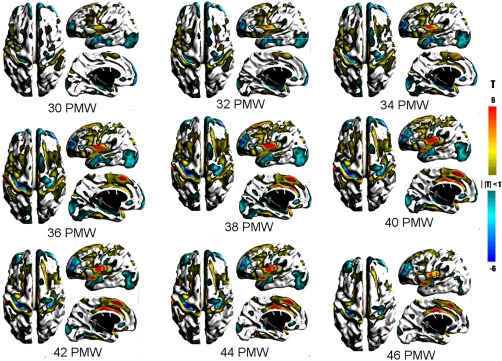
Figure 8.

T maps showing statistically significant changes in surface thickness of the underlying WM underlying the cortical GM. Warm colors represent greater than average changes while cool colors represent lower than average changes in thickness. [Color figure can be viewed at http://wileyonlinelibrary.com]
