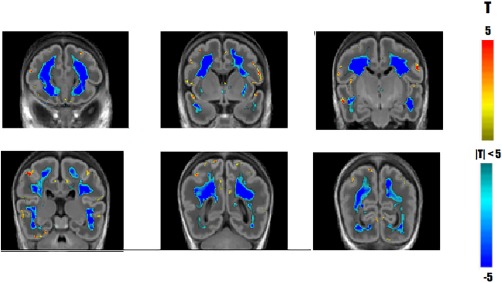
Figure 11.

Comparing spatiotemporal TBM with scalar, volume‐based TBM. Significant changes in growth rate detected using scalar TBM. Yellow and red areas indicate regions growing faster than the supratentorial growth rate while blue indicate regions growing slower than the overall growth rate. Coronal sections displayed anterior to posterior at 12 mm increments. [Color figure can be viewed at http://wileyonlinelibrary.com]
