
Figure 1.
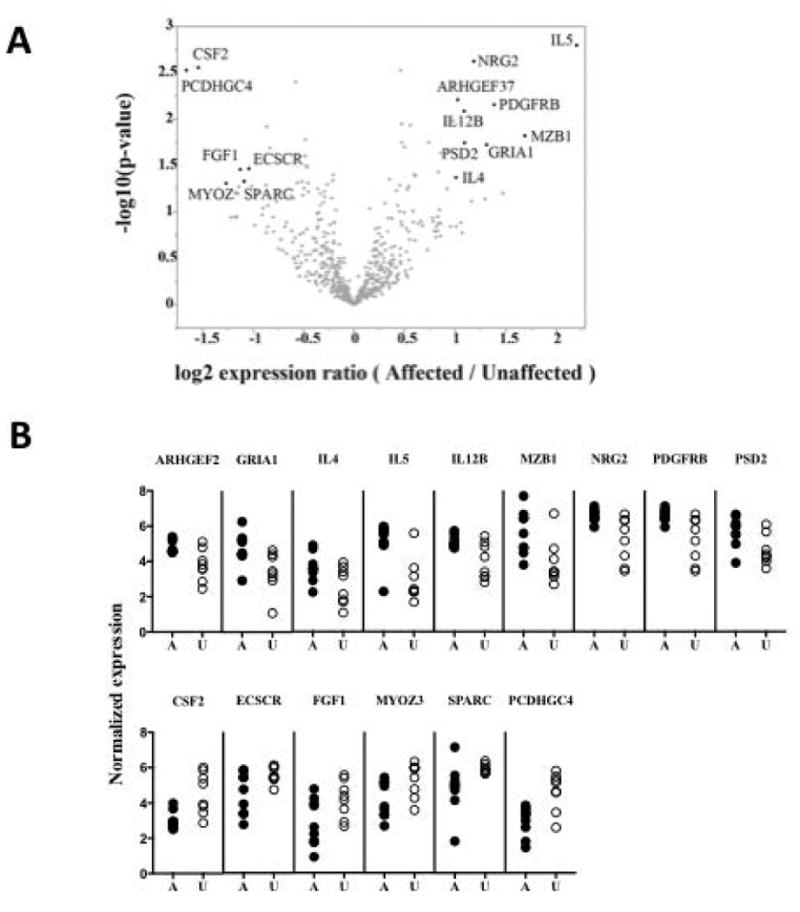
Gene expression analysis for chromosomal region [5q31.1 - 5q33.1]. (A) Results of ANOVA test for difference in geometric average expression. Probe sets with expression differences greater than 2–fold and (unadjusted) p-value < 0.05 are labeled with their corresponding gene symbol. The False Discovery Rate values for these selected genes ranged from 0.32 to 0.70. Thus, none of the expression differences in the region were judged be statistically significant once this correction for multiple testing was applied. (B) Individual subject expression levels for the selected, most differentially expressed, genes.