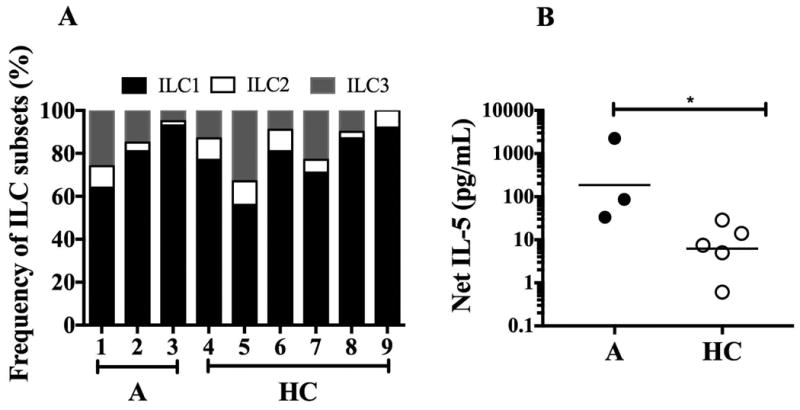
Figure 6.

ILC subset frequency and net IL-5 production in FE. A) Percentage distribution of ILC1, ILC2 and ILC3 subsets are shown for individual healthy controls (HC) and affected (A) family members. B) Net IL-5 release from unstimulated and PMA/Ionomycin stimulated, flow-sorted ILC2 subsets. Horizontal lines represent the geometric means for each group. *p<0.05 as compared to affected family members.
