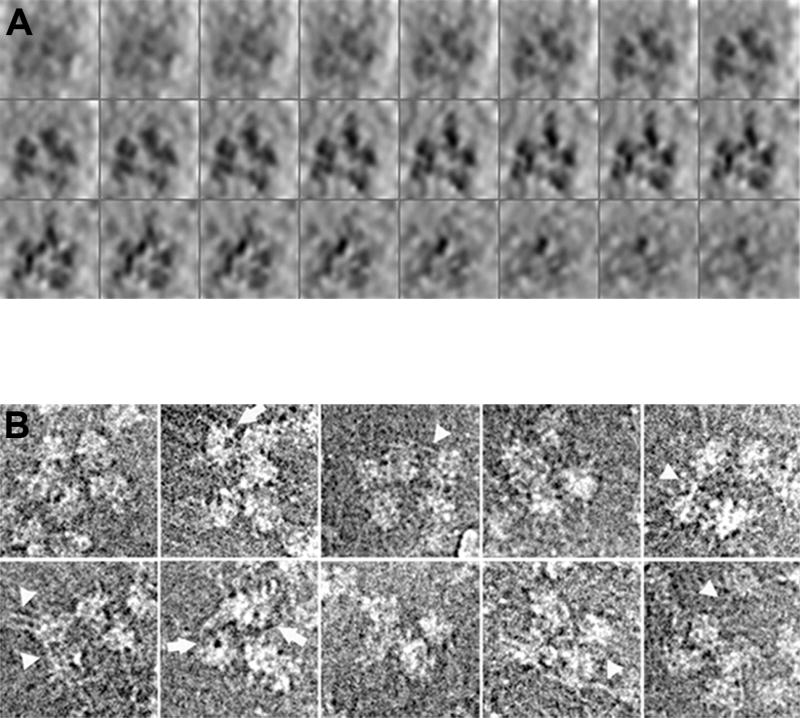
Fig. 4. Structural analysis of supraspliceosomes by cryo-EM.
(A) 3D image reconstruction of a supraspliceosome by automated cryo-ET. The reconstructed model of an ice-embedded supraspliceosome is presented as a series of x-y sections, 1.6 nm in thickness, along the z axis (top left to bottom right), enhanced by denoising. (B) Image restoration of selected ice-embedded supraspliceosomes. Particles displaying four or five substructures are presented. Some of the images display partially disassembled particles with an “opened-up” configuration. Fibrillary structures, presumably RNA covered with proteins, connecting the subunits are visualized particularly in the more open configurations (arrow-heads). Also, low-density areas, representing holes in the native spliceosomes, are visualized in several substructures (arrows). Adapted from Ref [36].

