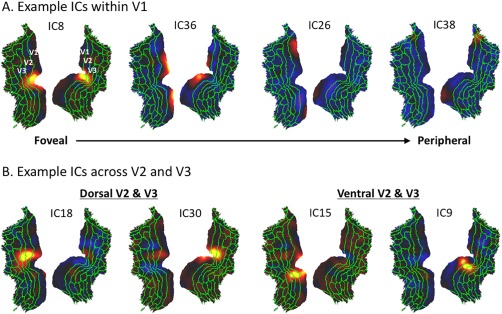
Figure 3.

Discrete ICs within the early visual areas (V1/V2/V3). A: Four ICs within V1. B: Four ICs across V2 and V3. The green lines are the borders of the MMP (Glasser et al., 2016), where V1/V2/V3 are defined. [Color figure can be viewed at http://wileyonlinelibrary.com]
