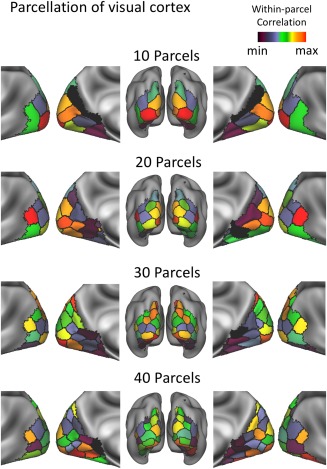
Figure 7.

Functional parcellation of the visual cortex with a varying number of parcels (k = 10, 20, 30, and 40). The parcels were color‐coded according to the averaged within‐parcel correlation. [Color figure can be viewed at http://wileyonlinelibrary.com]
