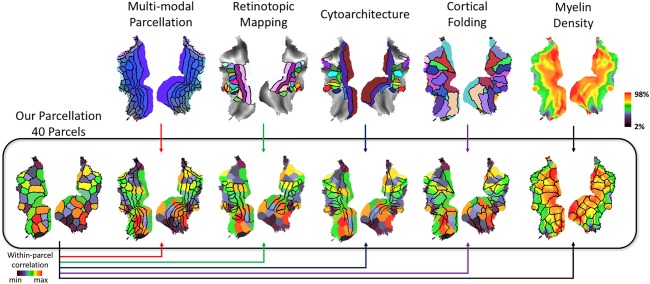
Figure 8.

Comparing our parcellation (k = 40) with existing visual cortex parcellations. Our functional parcellation is compared against (1) whole‐brain multimodal images (i.e., MMP; Glasser et al., 2016); (2) visual‐field maps (Abdollahi et al., 2014); (3) cytoarchitecture (Eickhoff et al., 2005); (4) cortical folding patterns (Destrieux et al., 2010); (5) cortical myelination (Glasser et al., 2014). The color vs. black arrows indicate the different sources of the underlay (black) versus overlap (color). With a color arrow, the functional parcellation obtained in this study is shown as the underlay, while an existing parcellation is shown as the overlay. With a black arrow, it is the opposite. [Color figure can be viewed at http://wileyonlinelibrary.com]
