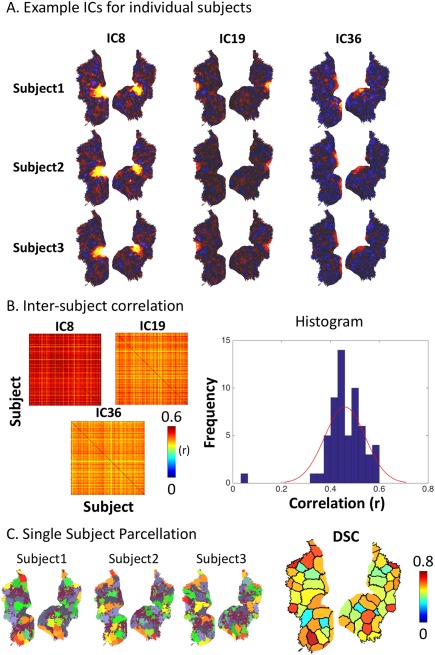
Figure 9.

ICs and parcellations from three individual subjects obtained through dual regression. A: Three example ICs from three subjects. B: The left panel shows the matrices of intersubject spatial cross‐correlations (r). The right panel shows the histogram of intersubject correlations for all ICs, as well as its fitted distribution. C: The left shows the subject‐wise parcellations obtained from three example subjects. The right shows the quantified overlap between individualized parcellations and the group‐level parcellation. Each parcel is colored coded by the averaged DSC. [Color figure can be viewed at http://wileyonlinelibrary.com]
