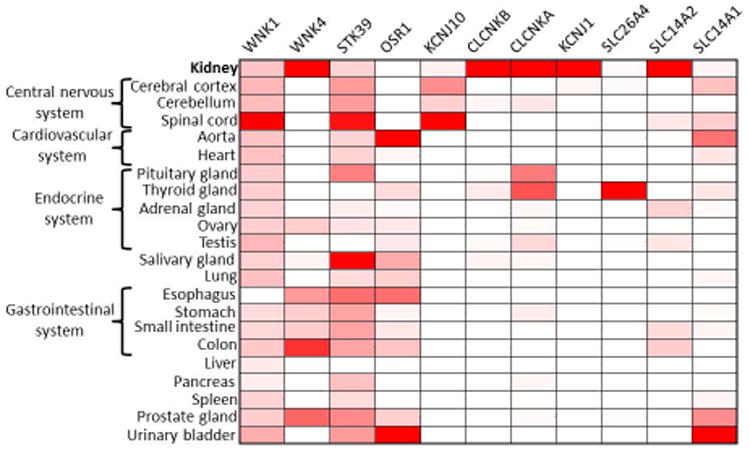
Figure 5. The tissue expression pattern of the novel diuretic target genes.

Heat map represents the abundance (red: presence, white: absence) of 11 potential targets of novel diuretics or aquretics (columns) across 22 human tissues (rows) based on public RNA-seq data (the Genotype-Tissue Expression (GTEx) Project, etc.). Color intensity represents fractional density expression of each mRNA across all tissues.
