
Figure 2.
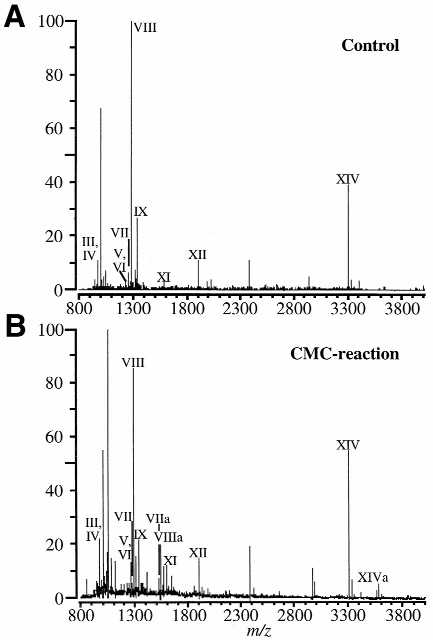
MALDI mass spectra of the RNase T1 digestion products of tRNAPhe. (A) Control sample. (B) CMC-reacted sample. Three new peaks appear in the CMC-reacted sample which correspond to the addition of a CMC group to a pseudouridine-containing oligonucleotide (see Table 1). Other peak assignments are listed in Table 1.