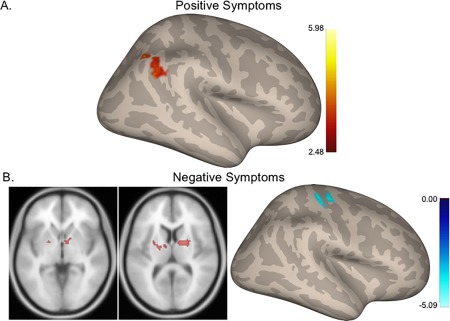
Figure 2.

Relationships between connectivity and symptom severity in the SCZ group. (A) Higher connectivity between the thalamus and visual cortical regions is associated with more severe positive symptoms. (B) Greater connectivity between lateral M1 and basal ganglia regions is associated with more severe negative symptoms while, (C) greater connectivity within the motor cortex is associated with fewer negative symptoms. Hot colors: positive correlations. Cool colors: negative correlations. [Color figure can be viewed at http://wileyonlinelibrary.com]
