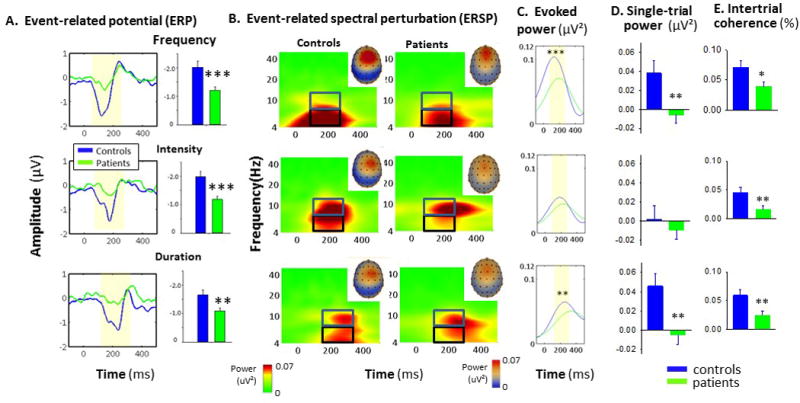
Figure 1.

A. Event-related potential (ERP) waveforms and mean amplitude (bars) to frequency, intensity and duration deviant stimuli. B. Event-related spectral perturbation (ERSP) responses as a function of time across frequencies (note log scale). Insets show scalp distribution of MMN-related activity. Boxes show alpha (blue) and theta (black) frequency bins. C. Evoked theta power over time. Shaded region represents area of integration. D. Single-trial power within theta frequency band to indicated deviants E. Intertrial coherence (ITC) within theta frequency band in controls vs. patients to indicated deviants.
*p<.05, **p<.01, ***p<.001 based upon between group t-test
