Figure 3.

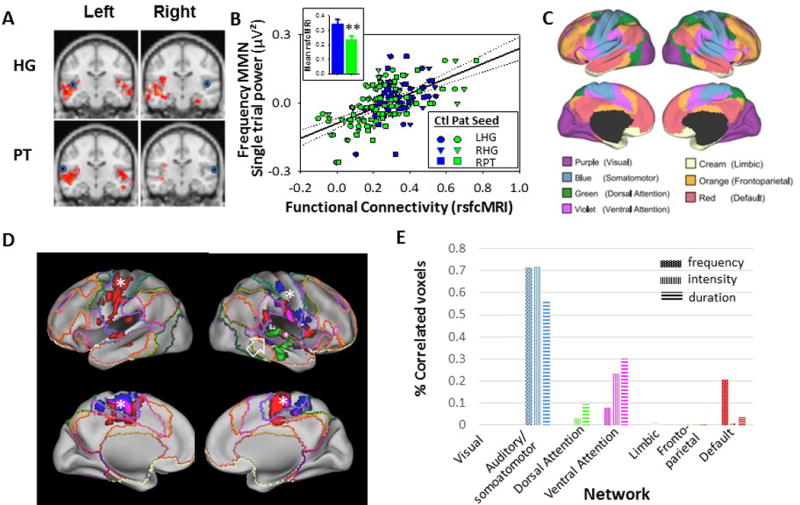
A. Group-difference maps (red shading) for rsfcMRI connectivity between indicated region and seeds placed in right and left Heschl’s gyrus (HG) and planum temporale (PT). Seed locations are shown with blue circles. Data were thresholded at p<.05 corrected for whole brain analysis. B. Correlation between indicated functional connectivity regions and theta single-trial power increases to frequency deviant stimuli across seed locations. Inset: Between-group difference in rsfcMRI connectivity between HG/PT seeds and auditory correlation region. C. functional connectivity networks adapted from the Human Connectome Project37, based upon the cortical parcellation approach81. D. Correlation network for HG seeds mapped onto canonical networks for frequency (green), intensity (red) and duration (blue) deviants. Note localization of networks related to frequency MMN generation primarily to auditory regions (open arrow), vs. more distributed networks involved in intensity/duration MMN (asterisks) E. Percentage of voxels by canonical networks showing correlation to HG/PT seeds for frequency, intensity and duration deviants. Percentages were adjusted for relative size of each network
