
Figure 3.
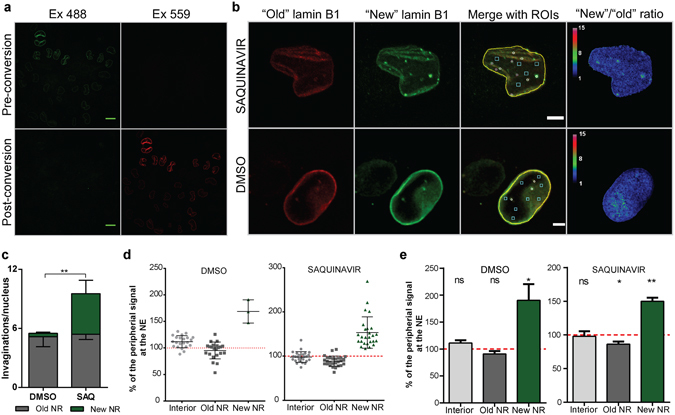
MAPLE3 photoconvertible tag allows tracking of nascent lamin B1 delivery to newly forming NR. (a) Confocal microscopy on HeLa cells 24 hours post-transfection with MAPLE3-lamin B1 encoding plasmid. Top panel corresponds to cells imaged before photoconversion (Pre-conversion) that emit green fluorescence upon excitation with 488 nm laser (Ex 488), but no red fluorescence upon excitation with 559 nm laser (Ex 559). Bottom panel (Post-conversion) presents the same cells imaged immediately after photo-conversion with 405 nm light, revealing complete switch in fluorescence emission from green (Ex 488) to red channel (Ex 559). Scale bar, 10 µm. (b) HeLa cells treated with either saquinavir or vehicle control (DMSO) and imaged 22–26 hours after complete photoconversion of MAPLE3-lamin B1. “Old” lamin B1 channel corresponds to the pool of lamin B1 existing in the cell immediately after photoconversion, while “new” lamin B1 corresponds to nascent copies of lamin B1 delivered to the nucleus post-conversion. Merge image shows Regions of Interest (ROIs) as follows: yellow line, nuclear periphery; white circles, old NR (structures visible in red channel); magenta circles, new NR (structures visible in green channel only); cyan squares, nuclear interior without structures. Ratiometric image comparing pixel intensities of green channel (“new” lamin B1) over red channel (“old” lamin B1). Scale bar, 5 µm. (c) NR invagination count in control (DMSO) and saquinavir-induced (SAQ) cells. Old NR has been identified in red channel, while new NR was defined by structures present in green channel only. Results from three independent experiments, 54 cells in total per condition; mean ± SD. (d) An example data plot from a single experiment showing distribution of “new”/”old” lamin B1 ratio at different nuclear structures and normalised to the nuclear rim ratio. (e) Pixel intensities of the ROIs defined in (B) based on the ratiometric images and normalised to the signal at the nuclear rim showing increased incorporation of nascent lamin B1 at the newly forming NR channels; results from three independent experiments, 54 cells in total; mean ± SD; **p < 0.001; *p < 0.05; ns, p not significant.