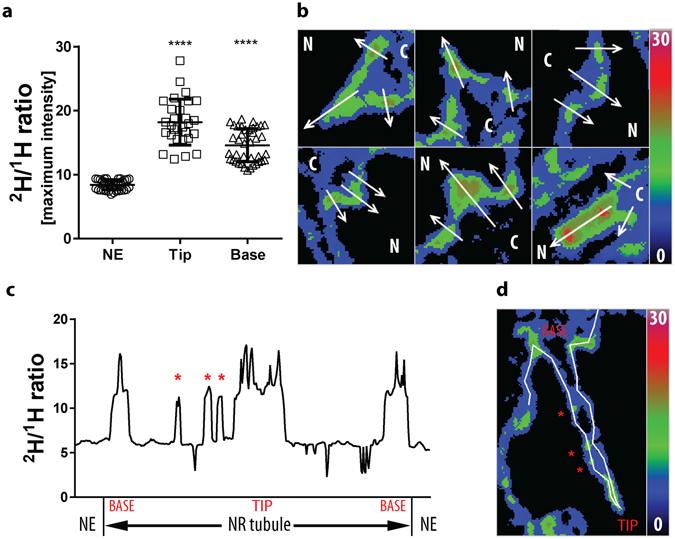
Figure 7.

Quantification of the nascent phospholipid enrichment at NR structures in the NanoSIMS experiments. (a) Scatter plot showing maximum intensity of 2H/1H ratio at the bulk nuclear envelope (NE), and the tip and base regions of NR invaginations in mouse preadipocytes pulse labelled with deuterated choline chloride; mean ± SD indicated; ****p < 0.0001. (b) Examples of ratiometric images used for quantification of the 2H/1H ratios with indicated line profiles corresponding to the base region (outer arrows) or tip (middle arrow) of NR tubules; N, nucleoplasm; C, cytoplasm. Note the different appearance of these images from NanoSIMS images presented in other figures, due to using ratiometric images for measurements rather than HSI images. (c) Plot profile of 2H/1H ratio along a typical invagination shown in (d); asterisks correspond to focal PC inclusion sites along the tubule length. Colour scale of 0–30 equals 0–0.3% of 2H/1H ratio.
