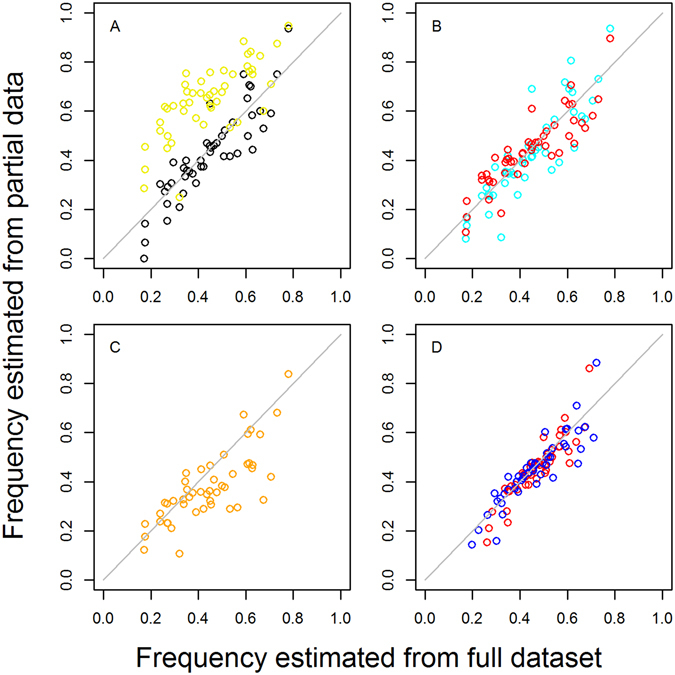
Figure 3.

Estimating mutant frequencies in parasite populations: validation of different methods using 540E and MOI data from cross-sectional surveys of 5131 people in 2004 and 2007 in 24 divisions in Tanzania39. Ideally, frequencies are estimated using detailed data from all infected individuals on their MOI and whether an infection is pure resistant, pure wild type or mixed. We plot 540E frequencies estimated using only partial data, such as is more often available from routine surveillance of mutations (Methods 3–5), against frequencies estimated from this full dataset for each location (Method 2; x axis on all panels) : (A) black points: 540E frequencies estimated by excluding mixed infections (Method 1A vs Method 2A); yellow points: for comparison we also show the prevalence of any 540E mutation among infected individuals (B) blue points: 540E frequencies estimated from data on mixed infections and mean population MOI (Method 3A vs Method 2A); red points: 540E frequencies estimated from data on mixed infections but with no MOI data (Method 5A vs Method 2A), instead estimating mean MOI using the Malaria Atlas Project slide prevalence and the relationship in Fig. 4 (C) orange points: 540E frequencies estimated with no MOI data nor data on mixed infections, using data on resistance prevalence only (Method 8A vs Method 2A) (D) red points: 540E frequencies estimated with data on mixed infections but no MOI data when detection of clones is imperfect, either assuming clones are missed in high MOI infections (Method 5B vs Method 2B) or (blue points) clones have a constant probability of being missed in any infection (Method 5C vs Method 2C).
