
Fig. 2.
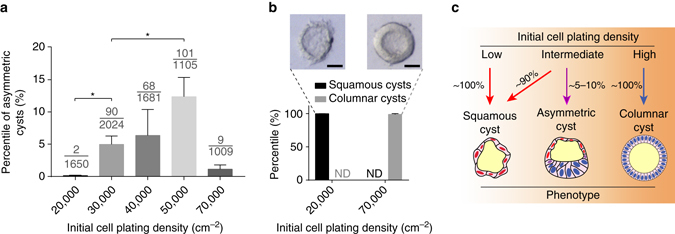
Asymmetric cyst formation is sensitive to initial cell plating density. a Bar plot showing the percentage of asymmetric cysts formed on day 4 at different initial plating densities (indicated on the x-axis); all other conditions are identical. Data represent the mean ± s.e.m. The denominator of each fraction indicates the total number of cysts quantitated for that condition; the numerator of each fraction indicates the number of asymmetric cysts among the quantitated cysts. P-values were calculated using unpaired, two-sided Student’s t-test. *P < 0.05. n = 3–5 biological replicates. n = 3 independent experiments. b Bar plot showing the percentage of fully squamous amniotic ectoderm-like cysts and fully columnar cysts under low-extreme and high-extreme cell plating densities. ND not detected. Phase-contrast images show representative squamous (left) and columnar (right) tissue phenotypes observed at these extreme conditions. n = 3 independent experiments. Scale bars, 30 µm. c Schematic summarizing the effect of initial cell plating density on the formation of the asymmetrically patterned epithelial cysts