
Fig. 4.
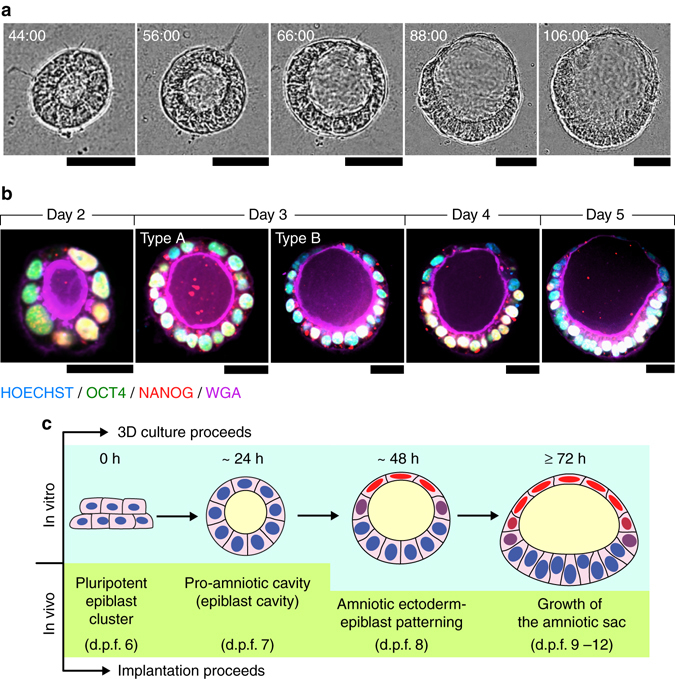
Developmental trajectory of PASE. a Representative time-lapse phase-contrast images showing dynamic morphogenesis during the development of a PASE. Time stamps indicate the total hours of culture. n = 3 independent experiments. Scale bars, 50 µm. Also see Supplementary Movie 1. b Confocal micrographs showing representative PASE on day 2, 3, 4, and 5, respectively, stained for OCT4 (green), NANOG (red), and WGA (purple). HOECHST (blue) counterstains nuclei. See Supplementary Fig. 8a for images from separate channels. n = 3 independent experiments. Early stage (day 2) PASE displayed an asymmetrically positioned lumenal cavity within a cyst that still exhibits a columnar morphology and is positively stained for both OCT4 and NANOG. Scale bars, 30 µm. c Cartoon showing the time course of PASE development in vitro, compared with human amniotic sac development in vivo