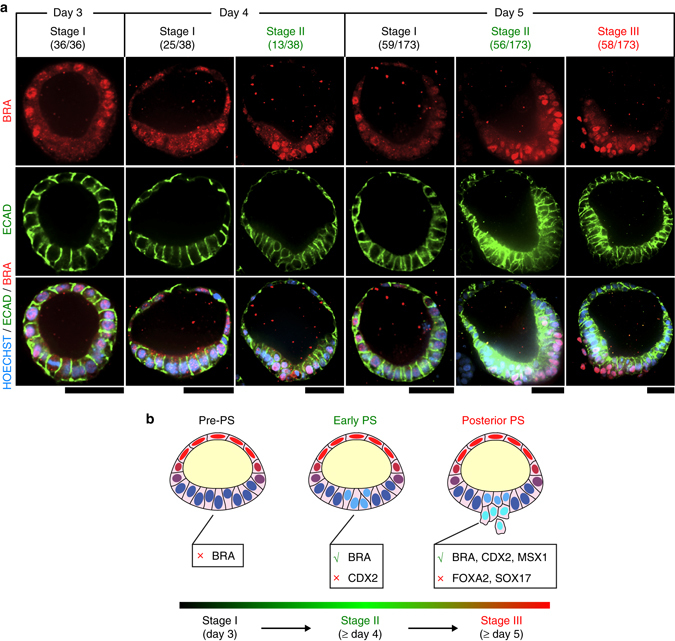
Fig. 7.

PASE model progressive stages of posterior PS development. a Representative confocal micrographs showing time-dependent, stage-wise spatial patterns of BRA (red) and ECAD (green) in PASE on day 3, 4, and 5, respectively. HOECHST (blue) counterstains nuclei. n = 2 independent experiments. Stage I (pre-PS), stage II (early PS), and stage III (posterior PS) PASE were observed to emerge sequentially in culture. The denominator reflects the total number of PASE quantitated for that day, while the numerator is the number of PASE at each stage among the quantitated PASE for that day. PASE were distinguished from squamous cysts and selected for quantitation based on their distinct asymmetric epithelial morphology. Scale bars, 50 µm. b Cartoon summarizing the three sequential stages of PASE development, with stage I, II, and III showing molecular features that resemble progressive posterior PS development through the pre-PS, early PS, and posterior PS stages
