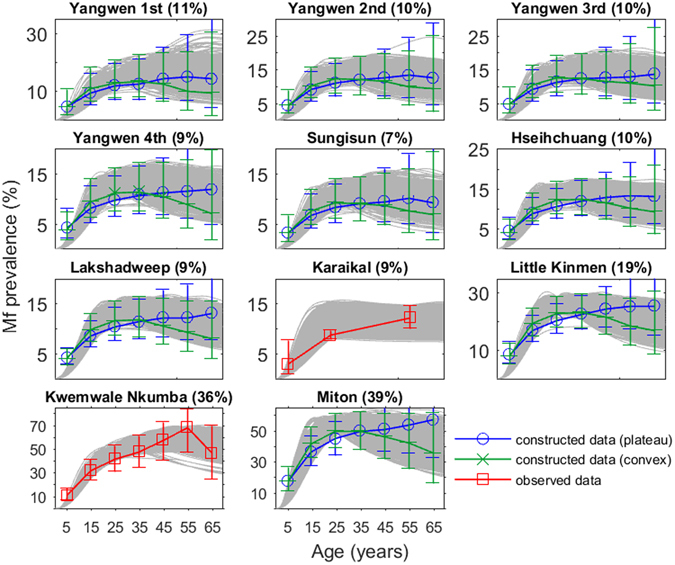
Figure 1.

Model fits to baseline prevalence data for the 11 sites used in this study. Model fits generated by the BM fitting procedure are shown as gray age infection curves. The data shown is either observed age-stratified infection prevalence (red squares) or constructed age profiles from observed overall prevalence where age-stratified data was not available (blue circles and green crosses). The overall community level prevalence, corrected for blood volume, is noted in parentheses following the village names in each subplot.
