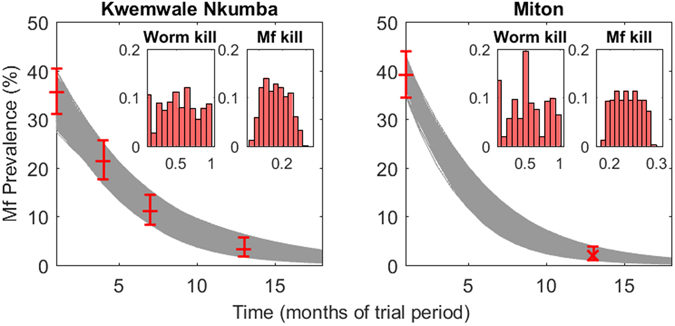
Figure 2.

Estimates of site-specific drug efficacies calculated from model fits to intervention community trial data. The 500 parameter vectors fitted to baseline conditions were used to project the impact of DEC-medicated salt with each vector simulated 500 times via sampling from an initial range of plausible drug parameter values. Intervention survey data used to accept or reject a parameter vector are represented by red crosses with 95% binomial error bars in the main plot axes. Gray curves are the model fits which ultimately informed the monthly worm and mf kill rates. Inset plots show the posterior relative frequency distributions of the monthly worm and mf kill rates for each site.
