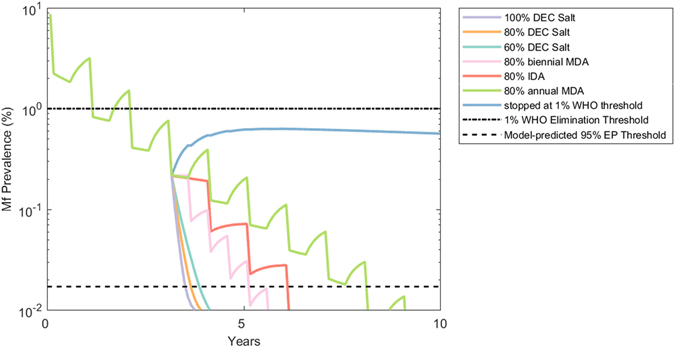
Figure 3.

Decline in mf prevalence in Lakshadweep, India, resulting from several different intervention scenarios. The median model-predicted trajectory is shown for each intervention strategy with no background vector control. For the first four years in this simulation, annual MDA at 80% coverage is applied after which one of seven alternative treatment strategies is adopted. The WHO 1% mf threshold and the model-predicted 95% EP threshold are shown as horizontal lines. Note that the y-axis is given in log-scale to better visualize transitions to low prevalence values.
