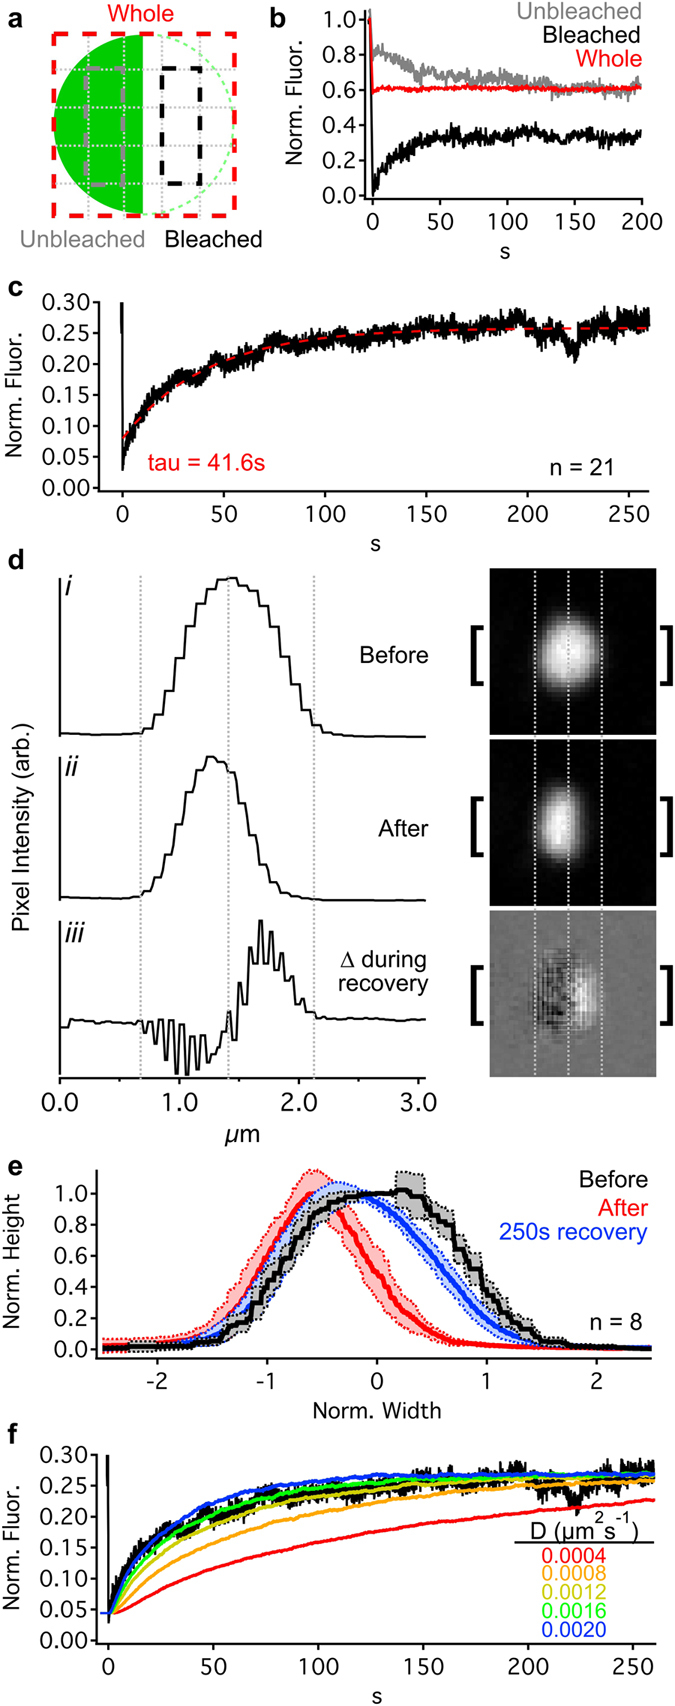
Figure 2.

Ribeye is dynamic and mobile within the ribbon. (a) Ribbon schematic showing measurement regions: the whole ribbon (dashed red), within the bleached (dashed black) and unbleached (dashed gray) hemispheres. (b) Normalized fluorescence profiles for each region in a following bleaching of half the ribbon (at 0 s) for an example ribbon (same as in d). (c) Average normalized recovery curve for bleached hemisphere (n = 21 ribbons; red: exponential fit). (d) Pixel intensity profiles (left) from regions between brackets in images (right) before (i) and after (ii) bleaching. The bottom profile and image (iii) show the average change in pixel intensity for each pixel over successive images during the first 50 time points (~17 s) of recovery. Gray indicates no average change, while brighter and darker values indicate gain and loss of fluorescence, respectively. (e) Pixel intensity profiles (mean ± SD, n = 8 ribbons) across the center of ribbons before (black), immediately after (red), and 250 s after (blue) bleaching. Ribbons diameters were normalized to the same width; the peaks of pixel intensities were normalized. (f) Average recovery of the bleached hemisphere (from c) compared to particle simulations with different diffusion coefficients (colored traces). Each simulation trace is an average of 20 runs. See also Supplementary Fig. S2, Supplementary Movie S1.
