
Figure 4.
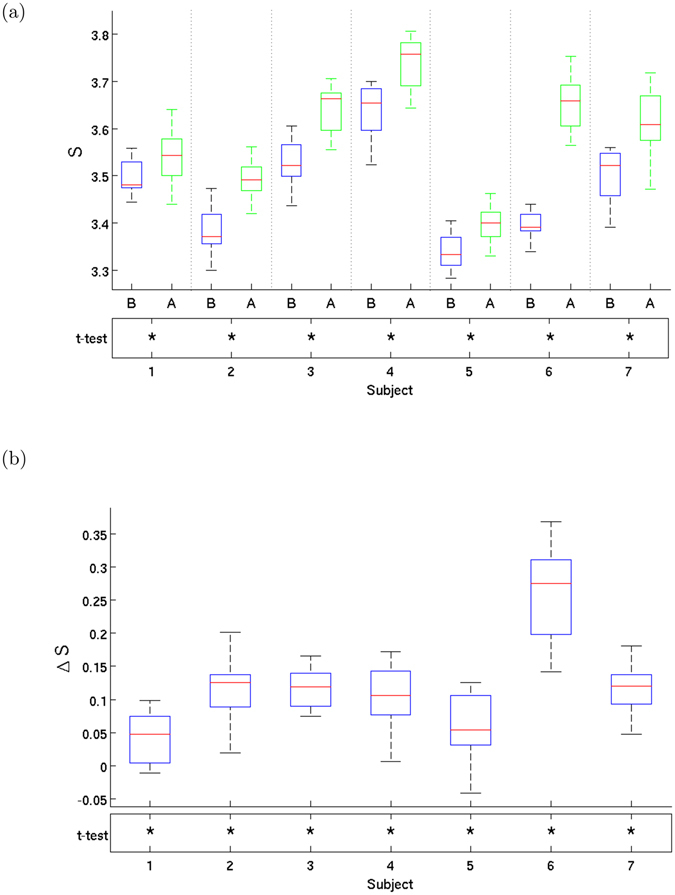
Entropy growth per subject. (a) Boxplot of the entropy distribution and before (B) and after (A) Ayahuasca ingestion and (b) boxplot of entropy increase, for all 7 subjects. Note the significant increase in entropy after Ayahuasca ingestion. There are 16 values of entropy per subject, as discussed in the text. The bars show minimum and maximum values and the box shows the 2nd and 3th quartiles, with the median shown dividing the box (in red). The asterisks (*) in the bottom rows in both plots indicate p-values p < 0.005 for Student’s paired t-test in (a) and t-test for zero mean in (b). Subject-by-subject, we thus find strong evidence against the null hypothesis of no entropy change.