
Figure 5.
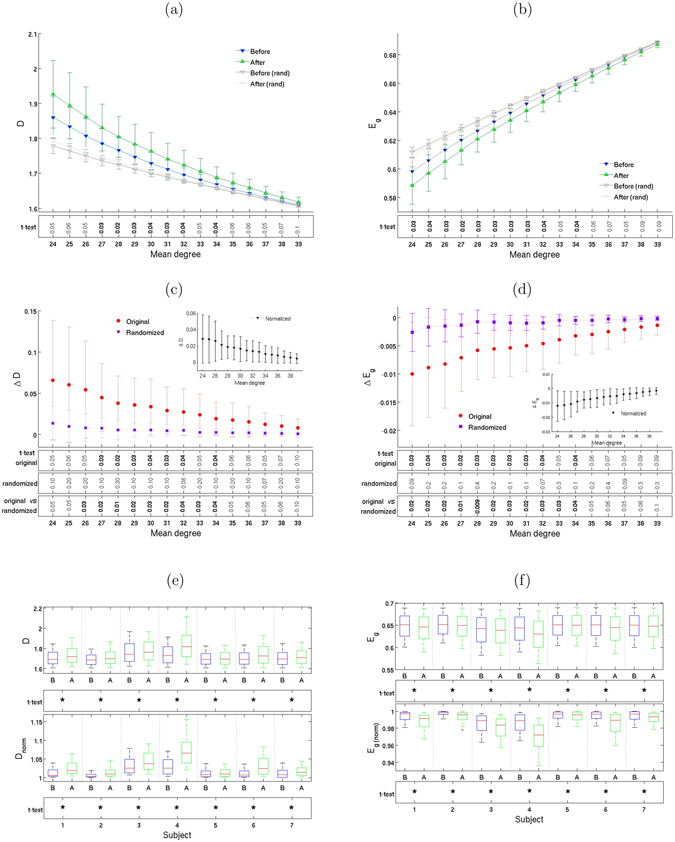
Global efficiency and integration decrease. Geodesic distance D (left column) and global efficiency E g (right column). Plots (a) and (b) show means ± 1 standard deviations, calculated from the complex networks of all 7 subjects, as well as from their corresponding iso-entropic randomized networks, for 16 different mean degrees. Plots (c) and (d) show the change in D and E g after Ayahuasca ingestion. The inset shows normalized values (see text). Boxplots (e) and (f) show the same information, subject-by-subject. As in previous figures, the rows below the plots show p-values for the t-test, with asterisks (*) indicating p < 0.005.