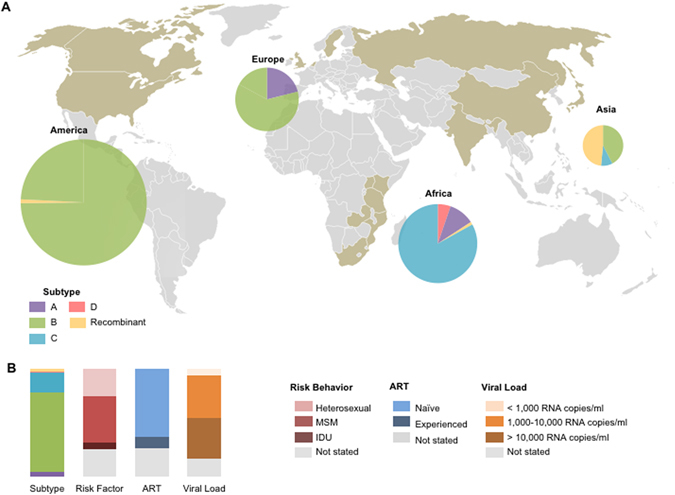
Figure 1.

Global cohort characteristics (A). Geographic and subtype distribution of 805 specimens from the shaded (taupe) countries. These specimens are further described in Tables 1 and S1–S5. Pie charts indicate the subtype of included specimens, where the diameter denotes the proportional representation of each continent to the total specimen. The map was generated by Microsoft PowerPoint (Version 15.30) using a template available at https://commons.wikimedia.org/wiki/File:Color_world_map.png which is released into the public domain at Wikimedia Commons, free media repository. (B). The profiles of the 805 specimens’ subtype, risk behaviors, ART status, and viral load.
