Figure 2.

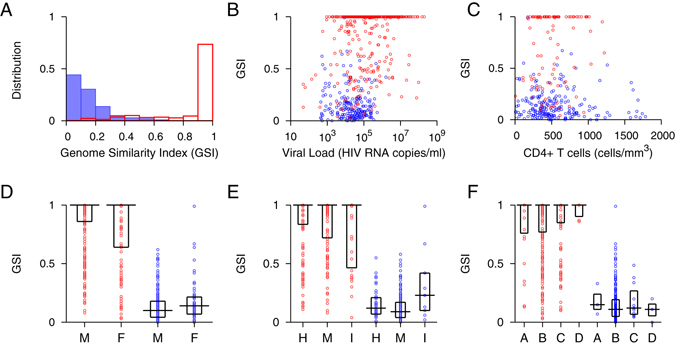
Genome Similarity Index (GSI) of incident and chronic infections. (A) The GSI distribution of 438 incident specimens is presented in red boxes and that of 305 chronic specimens in blue. The 305 chronic specimens include 274 chronic specimens listed in Table S1, 8 chronic specimens from the longitudinal cohort in Table S3 and 23 chronic specimens from the WIHS cohort in Table 1. The 438 incident specimens consist of 252 single time point incident specimens in Table S2 and 186 incident specimens from the longitudinal cohort in Table S3. All chronic specimens were collected from subjects documented to have been HIV-1 infected for over two years, and all incident specimens were collected within 2 years of HIV-1 infections, according to Fiebig staging and sampling intervals. The two distributions were clearly polarized; the majority of incident subjects had GSIs above 0.9, while all chronic subjects except one had GSIs below 0.67. (B) GSI and viral load for incident (red) and chronic (blue) specimens where viral load was available. Viral load did not significantly correlate with 207 chronic specimens’ GSI (Spearman’s correlation ρ = −0.069 and p = 0.32) but associated with 433 incident GSI (Spearman’s correlation ρ = 0.17 and p < 0.01) although, as indicated by a small correlation coefficient, this association was weak. (C) GSI and CD4 + T cell count where available were not statistically correlated in either 104 incident (red) or 209 chronic (blue) specimens (Spearman’s correlation ρ = 0.12 and p = 0.24 and ρ = −0.11 and p = 0.11, respectively). (D) GSI of male (M) and female (F) incident (red) and chronic (blue) specimens. Box plots represent median and first and third quartiles. Incident specimen’s GSI was not sensitive to sex (299 male vs. 142 female, Wilcoxon rank sum test, p = 0.22), but chronic GSI was sensitive (Wilcoxon rank sum test, p = 0.024), presumably due to unbalanced sample size (226 male vs. 55 female) as suggested by overlapping quartiles. In a permutation test, this association was nonsignificant (p = 0.076). (E) GSI of incident (red) and chronic (blue) specimens from different risk groups (H: heterosexual, M: men who have sex with men, I: intravenous drug user). Incident GSI was not sensitive to risk behavior (156 heterosexual vs. 143 MSM vs. 34 IDU, Kruskal-Wallis tests, p = 0.094), but chronic GSI was sensitive (Kruskal-Wallis test, p = 0.015), likely due to unbalanced sample size (46 heterosexual vs. 201 MSM vs. 9 IDU). The p-value was 0.009 in a permutation test. (F) GSI for incident (red) and chronic (blue) specimens of subtype A, B, C, and D. Neither incident (31 subtype A, 279 subtype B, 134 subtype C, and 6 subtype D) nor chronic (3 subtype A, 280 subtype B, 11 subtype C, and 3 subtype D) GSIs differed significantly among subtypes (Kruskal-Wallis test, p = 0.61 and p = 0.70, respectively).
