Fig. 3.

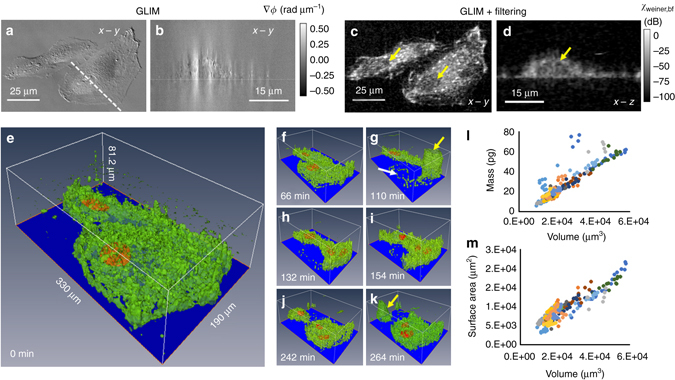
GLIM time-lapsed tomography of a HeLa cell culture. a x−y cross-section and b x−z cross-section of the GLIM phase-gradient measurement. Dashed line denotes the locations of the cross-section. c x−y cross-section and d x−z cross-section after spatial filtering. e–k Rendering of cell tomography results at different time, as indicated. Here, the cell nuclei are segmented and displayed in orange. The cell membranes are in green. l Mass vs. volume and m area vs. volume measurements extracted from the GLIM tomography data. Data points with the same color belong to the same cell but were acquired a different time points
