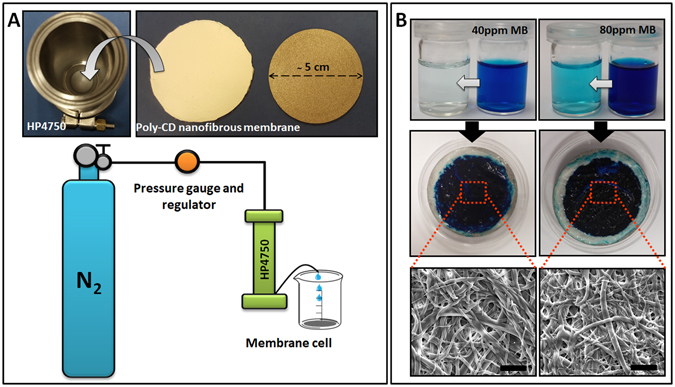
Figure 5.

Filtration performance of poly-CD nanofibrous membrane. (A) The photographs of membrane cell part of HP4750 dead-end system and the cropped poly-CD nanofibrous membrane with a definite active filtration area (14.6 cm2). The schematic view of HP4750 filtration system. For each test, 50 mL solution is passed through the poly-CD nanofibrous membranes with a definite N2 pressure. Then, the permeated solution is collected in a clear beaker. (B) The visual illustration of the MB solutions prepared at two different MB concentrations (40 and 80 mg/L) before and after filtration test. The photographs and SEM images (scale bar-10 μm) of the poly-CD nanowebs exposed to these two concentrated MB solutions during the experiments. As clearly seen, both the macroscopic visual appearance and the fibrous morphology of poly-CD nanofibers were protected under such applied pressure.
