Figure 2.

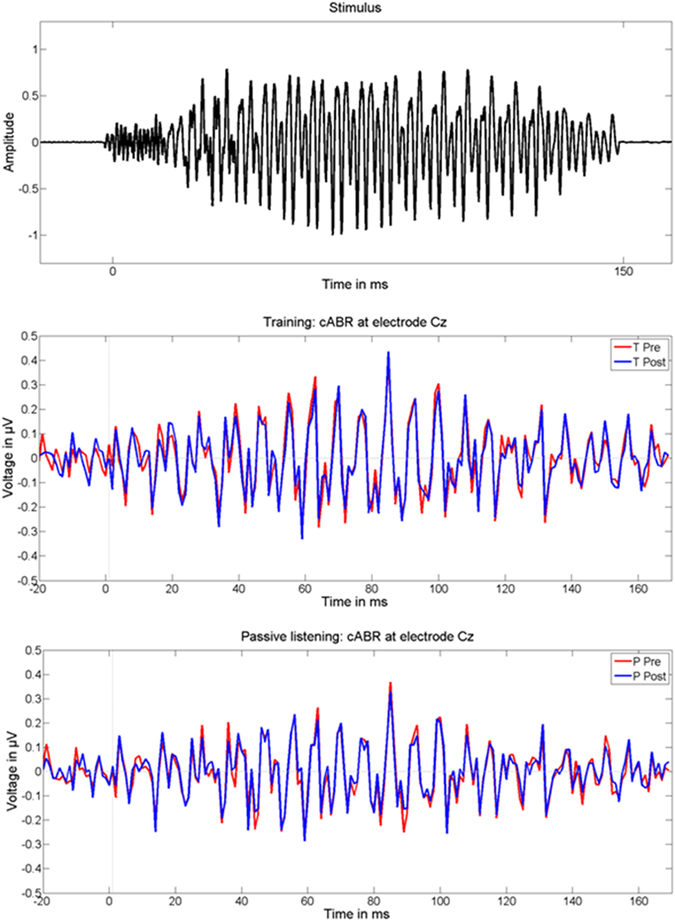
Stimulus waveform and FFRs (subtracted polarities). Top = stimulus waveform; middle = FFRs at T0 (pre, red line) and T1 (post, blue line) within the TG; bottom = FFRs at T0 (pre, red line) and T1 (post, blue line) within the PG.

Stimulus waveform and FFRs (subtracted polarities). Top = stimulus waveform; middle = FFRs at T0 (pre, red line) and T1 (post, blue line) within the TG; bottom = FFRs at T0 (pre, red line) and T1 (post, blue line) within the PG.