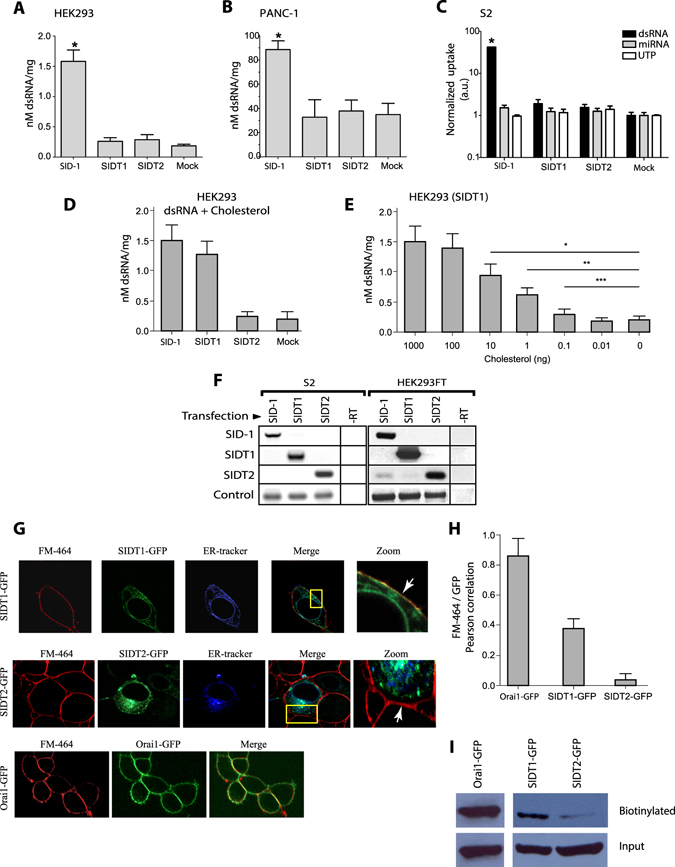
Figure 1.

Overexpression of SIDT1 or SIDT2 does not increase dsRNA uptake. HEK293 FT cells (A), PANC-1 cells (B) and S2 cells were transfected with SID-1 (from C. elegans), SDIT1 (human), SDIT2 (mouse) or empty GFP vector (Mock) and incubated with 5 ug/ml of radioactive dsRNA (700 nucleotides) for 2 hours at 37 °C. The molarity was calculated with the sequence of dsRNA and then normalized with the total protein of each sample. Error bar: SD; n > 5; *p < 0.01. (C) S2 cells from Drosophila melanogaster incubated for 4 hours at 37 °C with dsRNA (700 nt length), miRNA (pre-let-a) or the equivalent in counts per minute (c.p.m)of 32P-γ-UTP. The uptake was normalized with the total protein for each sample; a.u. arbitrary units. (D) Mixing 5 µg/ml of radioactive dsRNA with 10 ng of cholesterol results in dsRNA uptake in HEK293 cells overexpressing SIDT1, SIDT2, SID-1 or the empty vector. Values show the mean ± standard deviation of the amount of dsRNA incorporated per mg of total protein in the cell lysates. (E) Dose-dependent uptake of radioactive dsRNA-dependent on the cholesterol content in the mix (0 to 1000 ng of cholesterol). *p < 0.001; **p < 0.01; ***p < 0.05. (F) RT-PCR of each transfection in S2 cells or HEK293 FT cells. The actin gene (S2) and GAPDH (HEK293) were used as controls. -RT control without reverse transcriptase. (G) Confocal microscopy colocalization studies for SDIT1 or SIDT2 using FM-464 as plasma membrane marker and ER-tracker for the endoplasmic reticulum (ER). Notice in the zoom that SIDT1 shows very high co-localization with FM-464 whereas SIDT2 shows an intracellular localization co-localizing with ER tracker. (H) Mean ± standard deviation for Pearson’s correlation coefficient between FM-464 and GFP. Notice the very high co-localization between Orai1 channel, which was used as plasma membrane (PM) localization control with FM-464. SIDT1 shows very high co-localization as well, compared with the poor co-localization of SIDT2. (I) Biotinylation studies for Orai1-GFP, SIDT1-GFP and SIDT2-GFP. Notice the subtle amount of SDIT2-GFP found at the plasma membrane when compared to SIDT1-GFP and Orai1-GFP. All conditions were included in a single figure and no other bands were detected.
