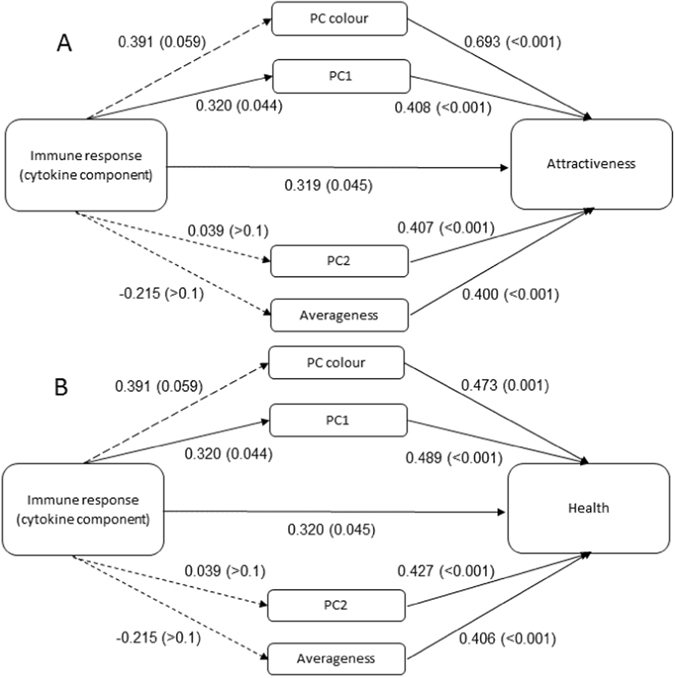
Figure 2.

Pearson’s Correlation coefficients for (A) log facial attractiveness and (B) perceived health. Values indicate Pearson’s correlation coefficients (r) with associated p-values in brackets. Short dashed lines indicate non-significant coefficients (p > 0.05), long dashed lines marginal associations (p < 0.1) and solid lines significant associations (p < 0.05). PC1 = masculinity, adiposity component; PC2 = symmetry, adiposity component.
